

Watch the film
Sound on
Close graphic icon.
Empowering Developers Nationwide

Every Site Where Your Density Is Allowed

Search an entire market on what you build, and know what every site yields.

Empowering developers nationwide:

Site Selection Is Still Manual

One Parcel at a Time Doesn't Scale

What decides whether a site works is buried in zoning tables, overlays, and commission minutes. Teams qualify sites by hand, and the ones that pencil still die at the hearing. Prophetic reads every code and tracks every commission, so you can work the whole market.

Every Parcel, Every Market

Find More Sites

Search an entire market at once on the density you intend to build, including off-market parcels. Then see the rental supply forming around each site, while it's still a cleared lot.
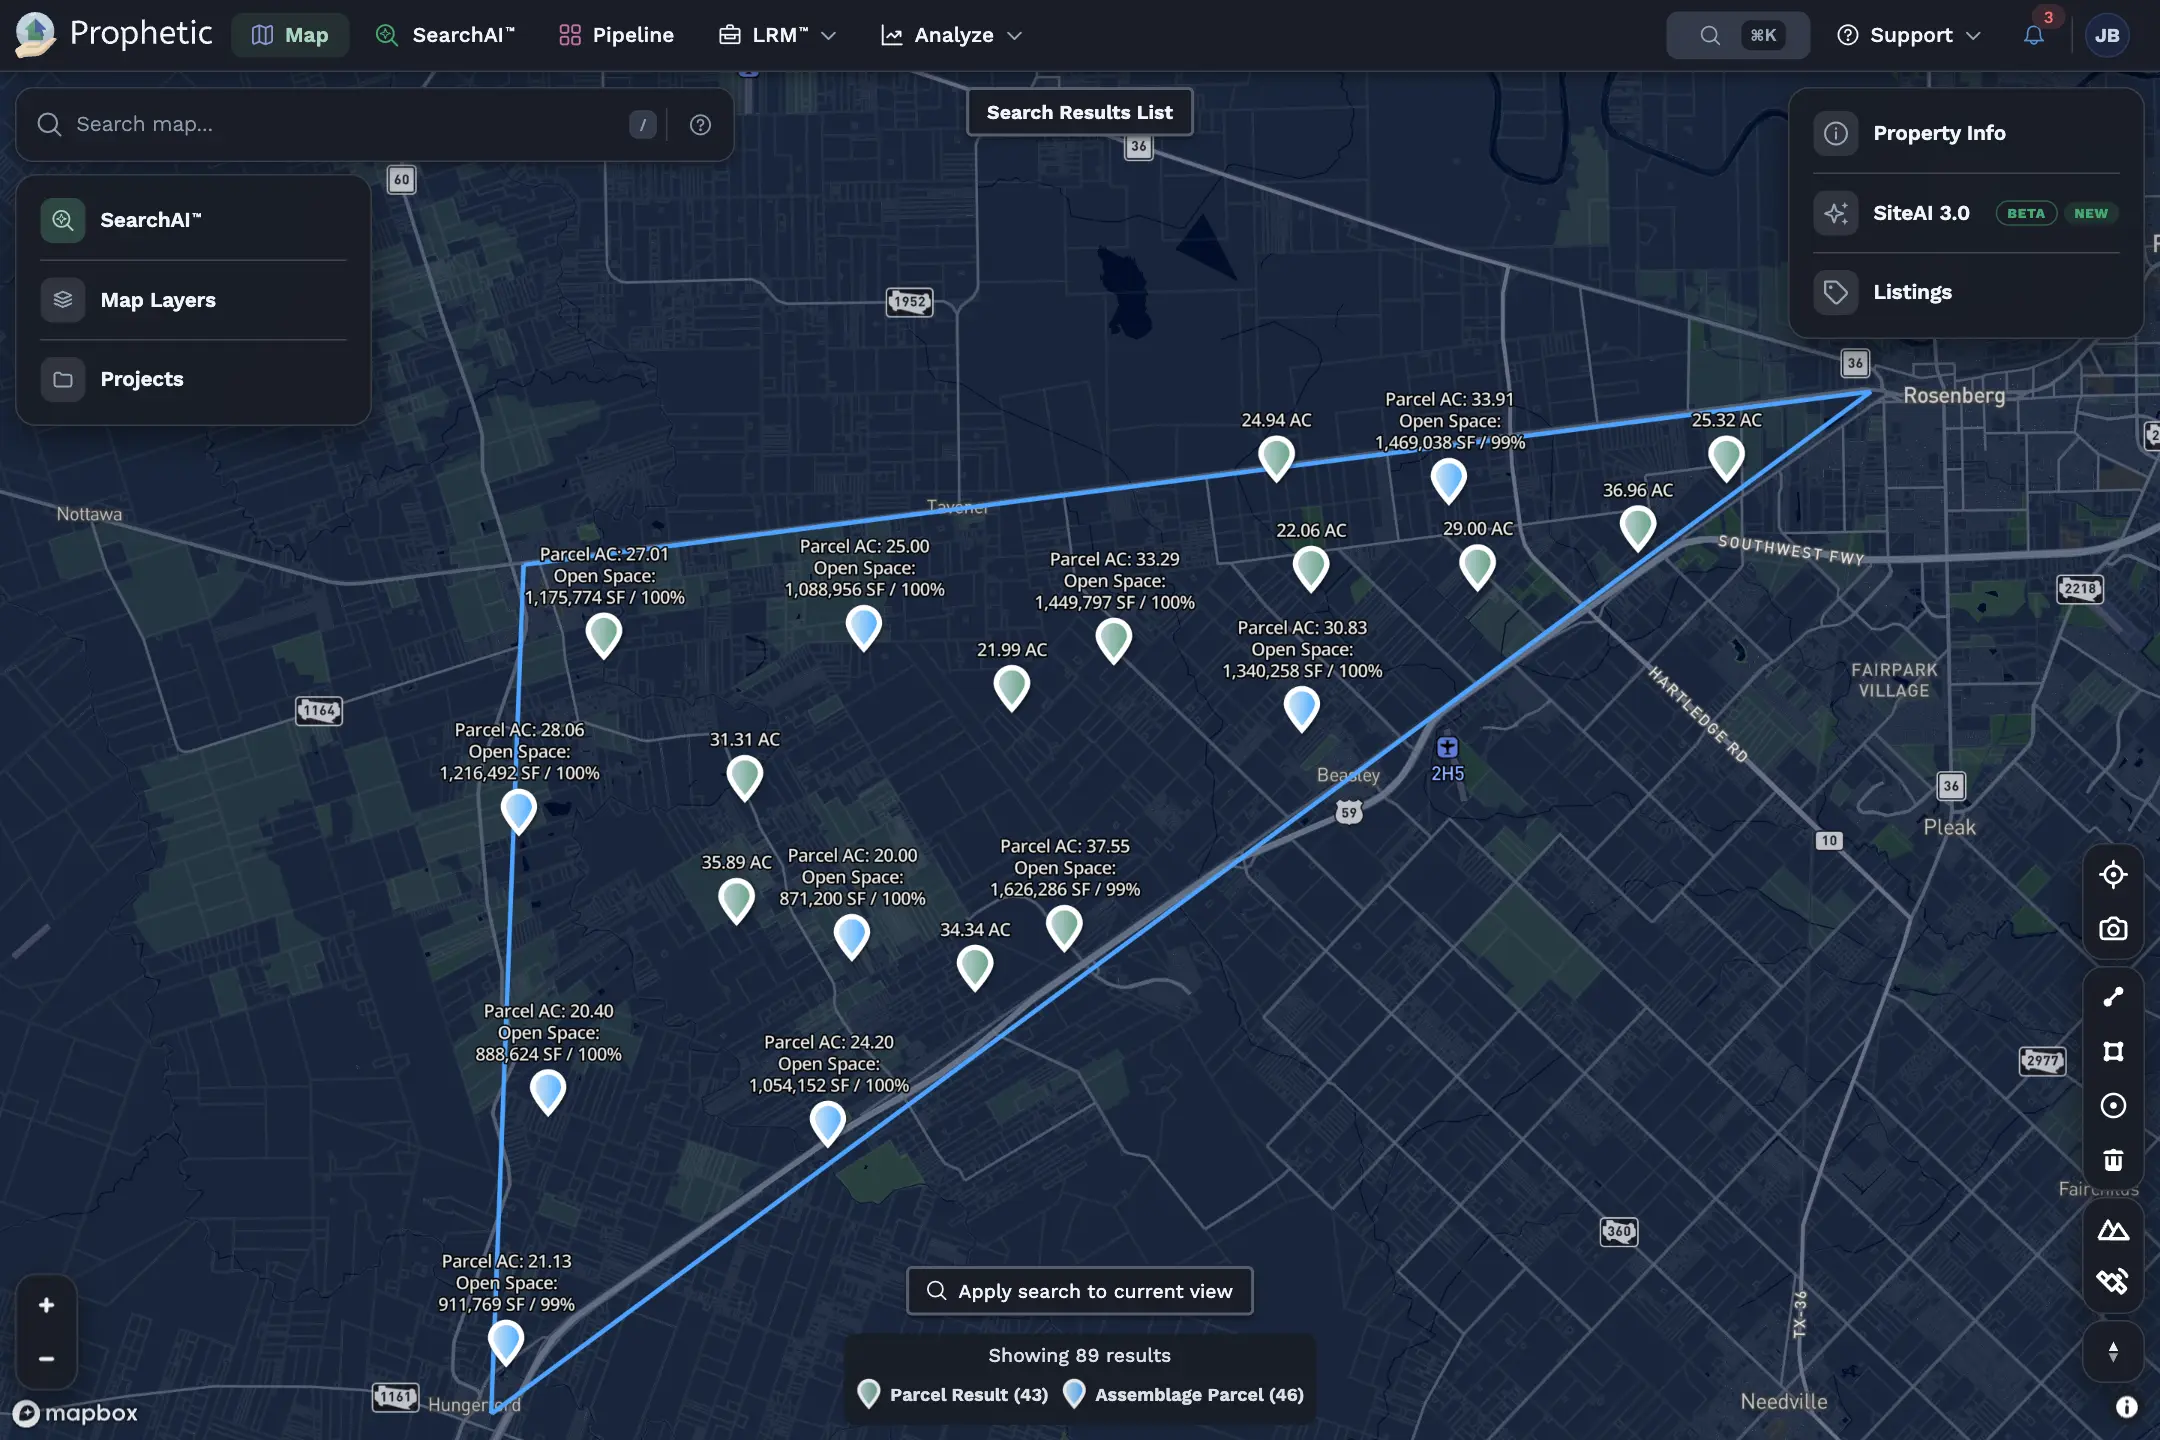
  • Search by what you build, not what's listed
  • Off-market parcels with the owner behind them
  • New rental supply, from permit to completion
Interactive map showing parcel boundaries and estimated property values, with color-coded regions, parcel data points, and a sidebar menu featuring map layers and market filters.

120+

Simple, one-click search intentions

5,000+

Parcels analyzed per month, per use

Decide Faster

Know What Pencils

Permitted use, density, height, and setbacks read from every code and cited to the page. Fit a building to the parcel and get unit count and 3D massing in minutes.
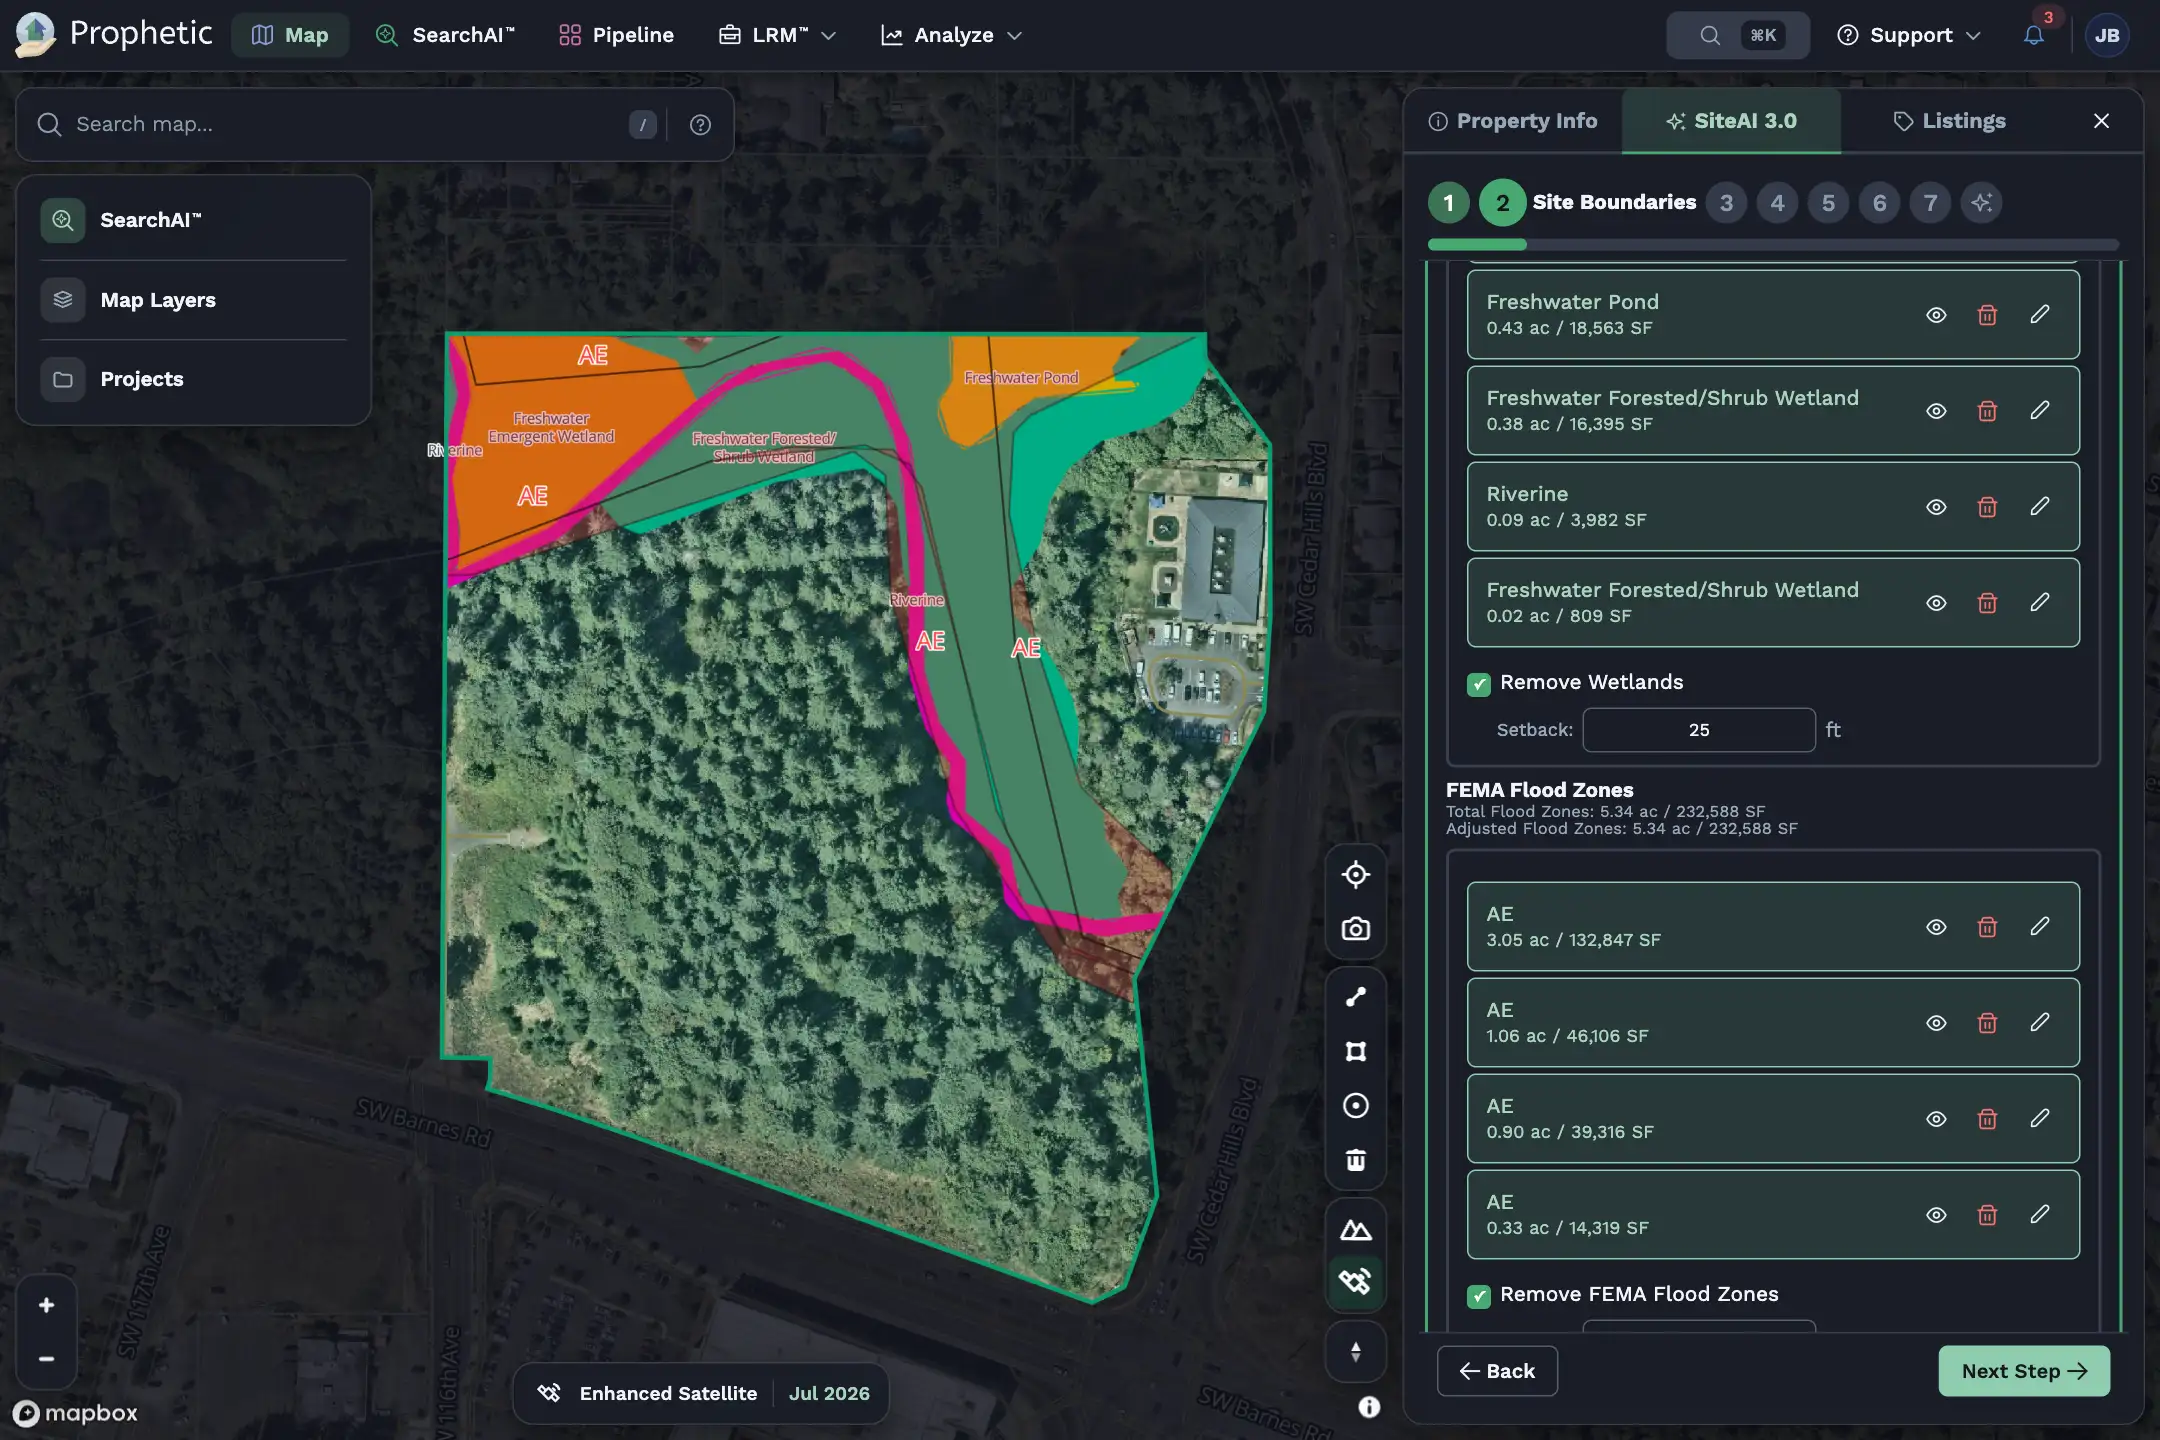
  • Zoning from 23,000+ municipalities, cited to the page
  • Unit count in minutes, not weeks
  • Utilities, wetlands, and floodplain in one view
SiteAI interface with a map showing site boundaries including wetlands and FEMA flood zones, with options to adjust or remove these areas and a 'Next Step' button.

23,000+

Municipalities read and cited

Minutes

From parcel to unit count

Win More Deals

Know the Room

See council and planning commission posture in every jurisdiction, so entitlement risk is priced, not guessed. Every site and conversation lives in one pipeline your whole team works from.

  • Council and commission activity in every jurisdiction
  • Reach owners before sites hit the market
  • Team knowledge that outlives the deal
Interactive map showing parcel boundaries and estimated property values, with color-coded regions, parcel data points, and a sidebar menu featuring map layers and market filters.

90%+

Less time spent on research

Days

From first find to a written offe

Interactive map showing parcel boundaries and estimated property values, with color-coded regions, parcel data points, and a sidebar menu featuring map layers and market filters.

Find It. Prove It Pencils. Move First.

Every site your density allows, from discovery through close, in the Operating System for Land Acquisition™