




You hear a major builder broke ground on 200 homes. Where? When did they acquire land? When did it go before the council? What are they asking, and have they cut prices since? Who else is building nearby?
By the time you have answers, the moment has passed.
Most market data is read backward: closed sales that are months old and supply pieced together by hand. The signals that move first, such as a council vote, a new entitlement, or a competitor's price change, are buried in agenda packets, county records, and builder websites.
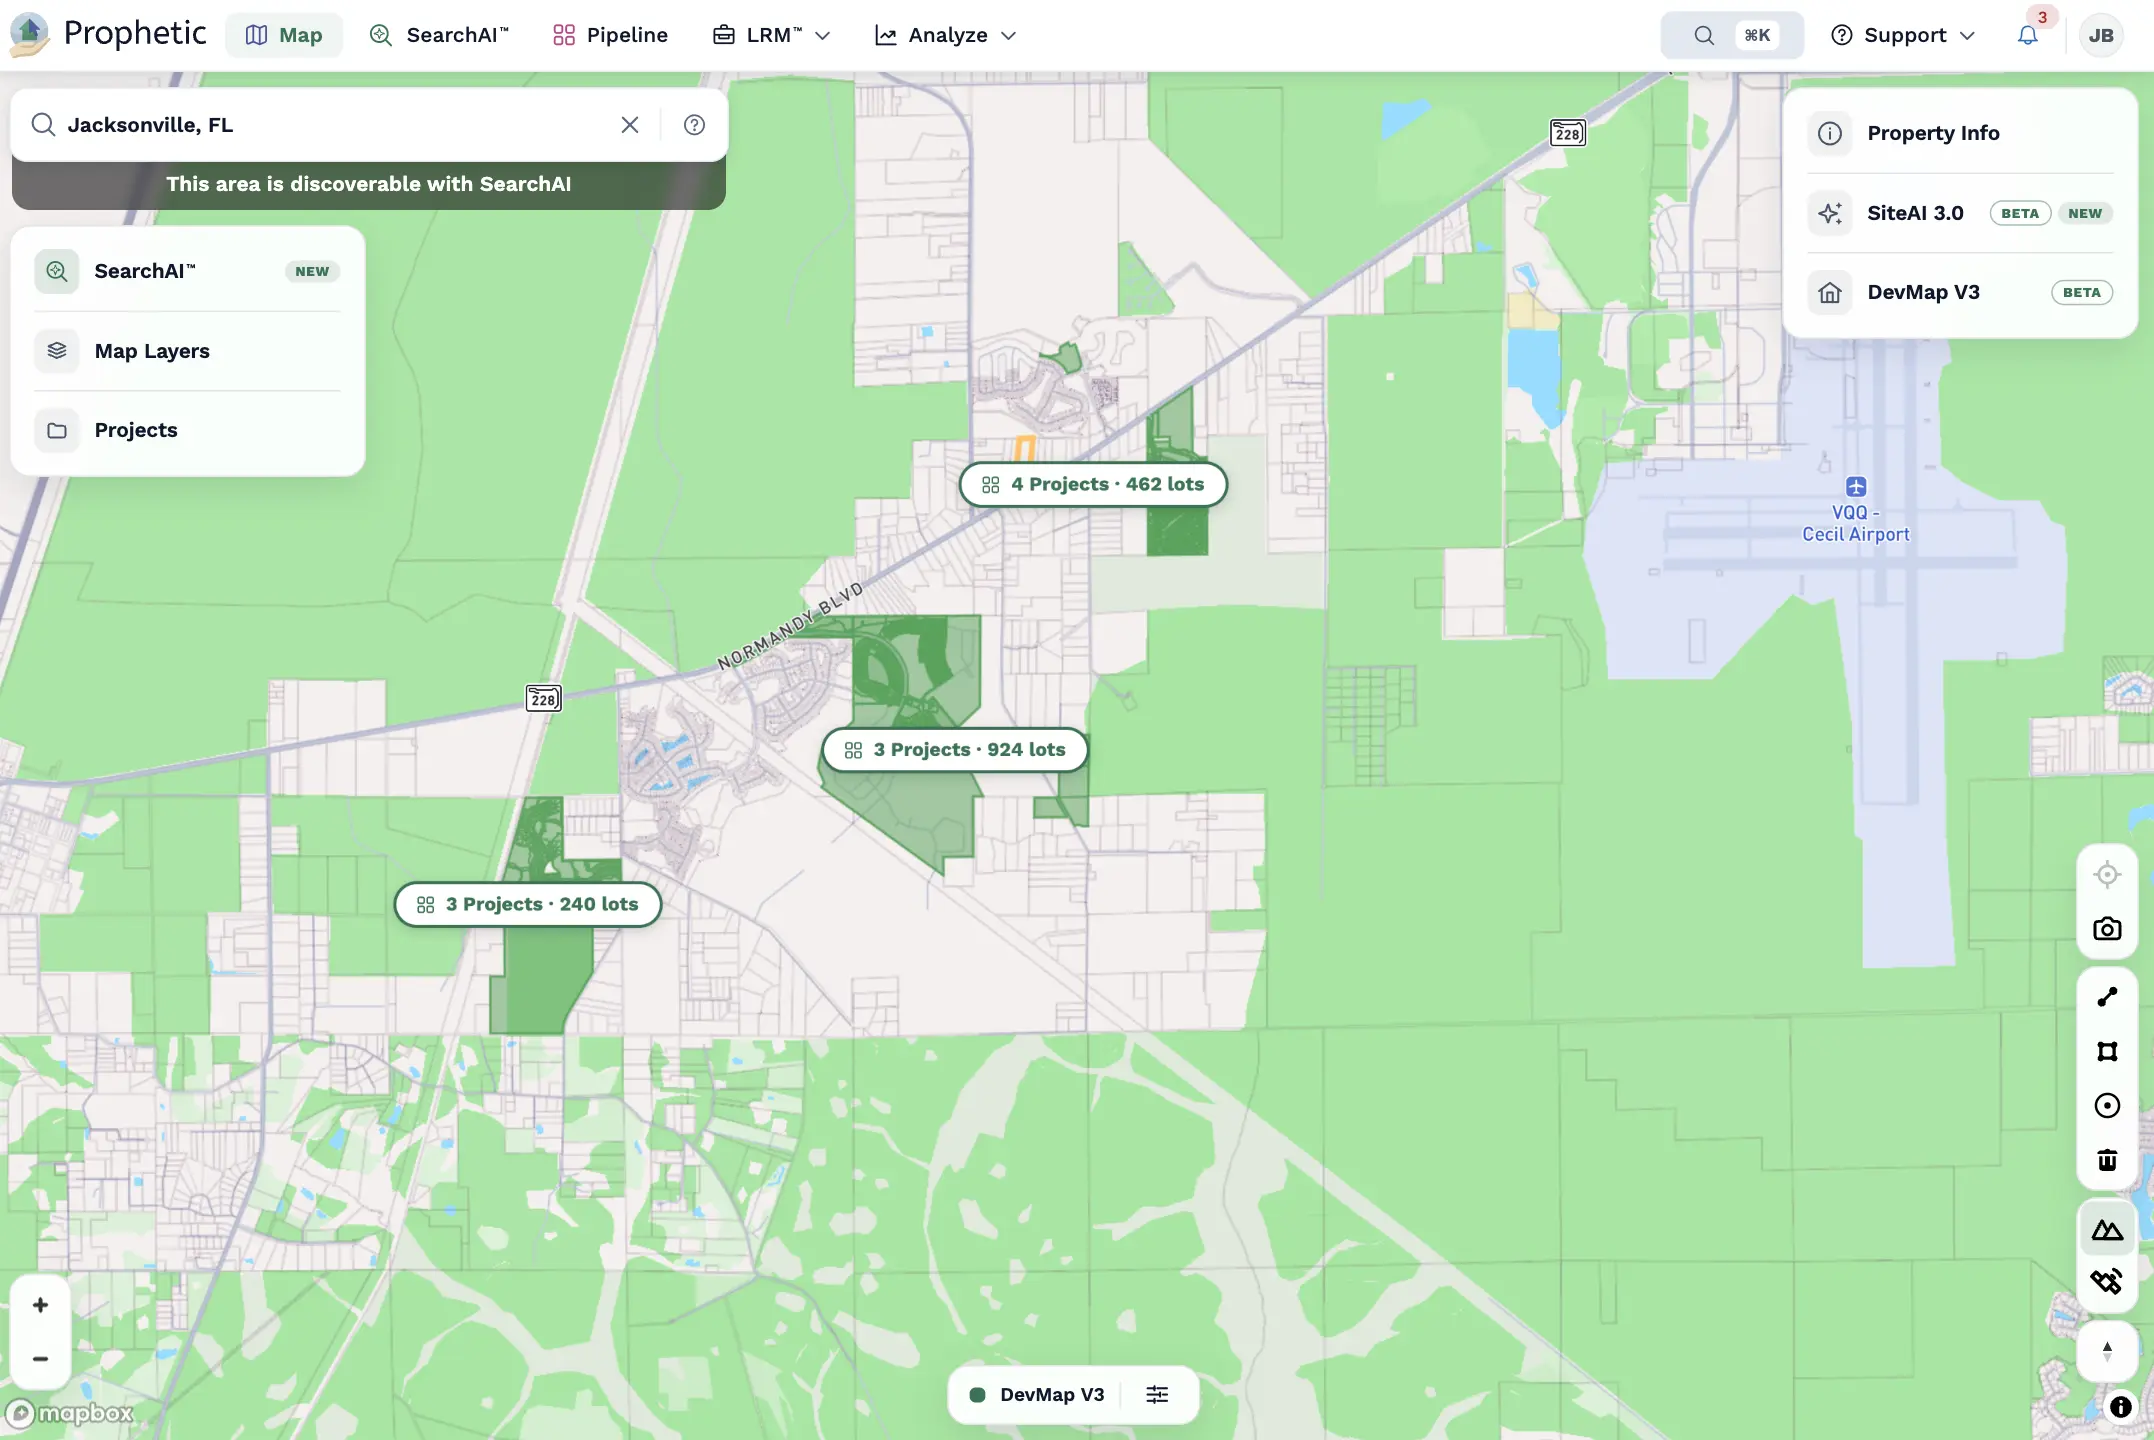
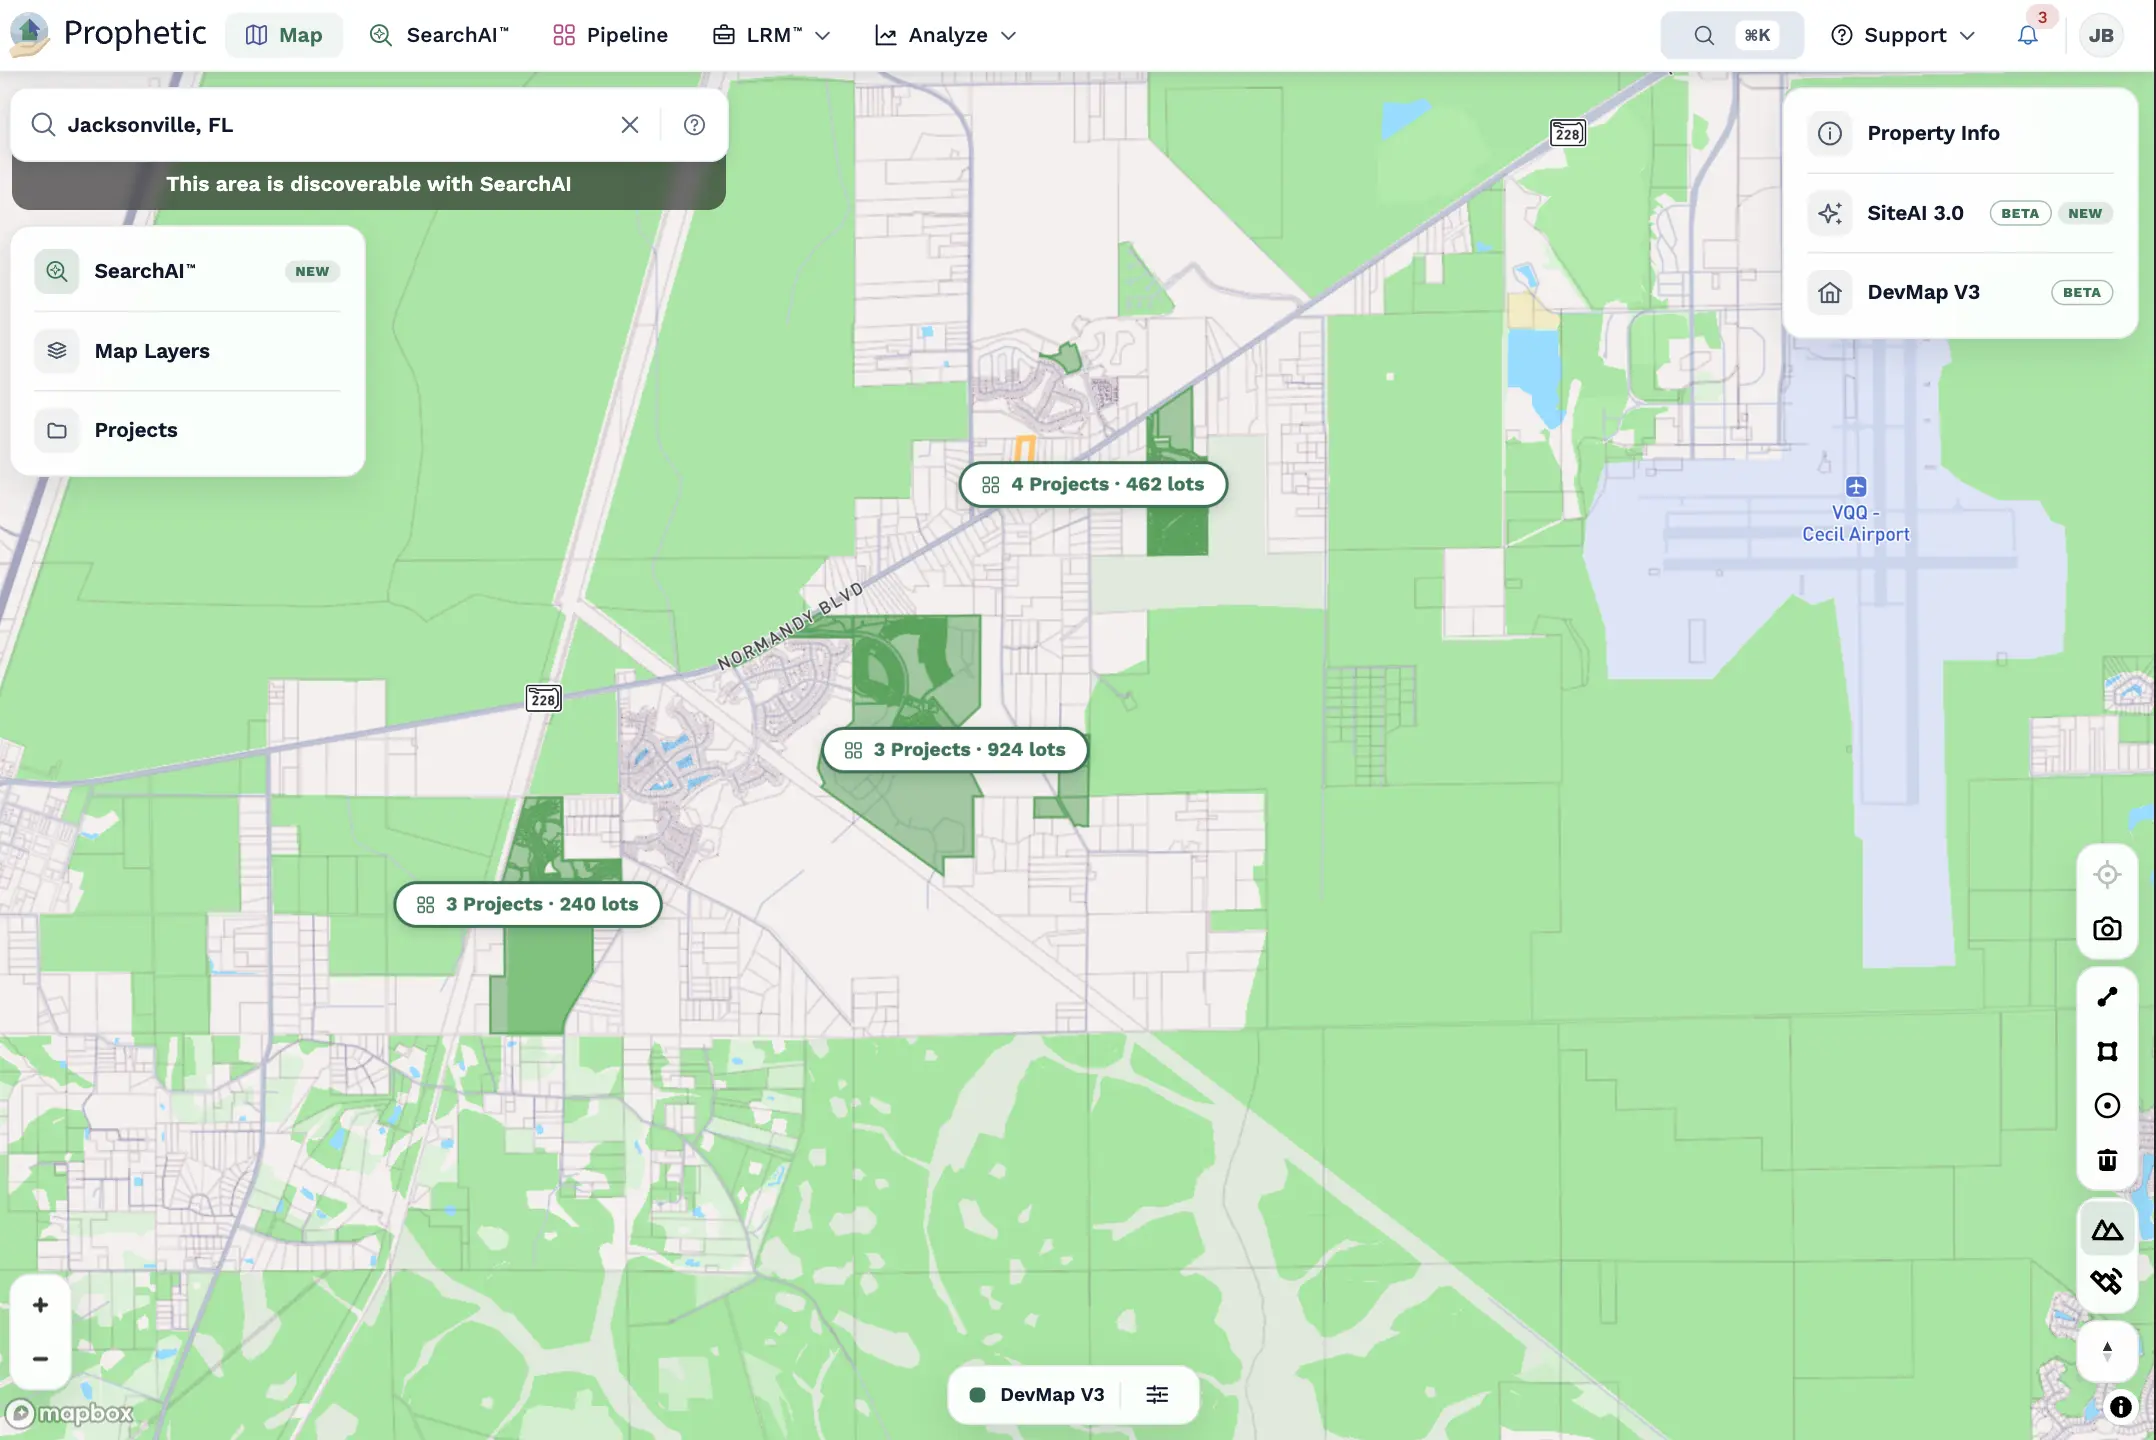
Prophetic Market Intelligence brings the signals that move first onto one map, the same one your team already uses to find land. Follow every project from its first council hearing through completion, and see what competitors are asking for their homes today.
CouncilAI™
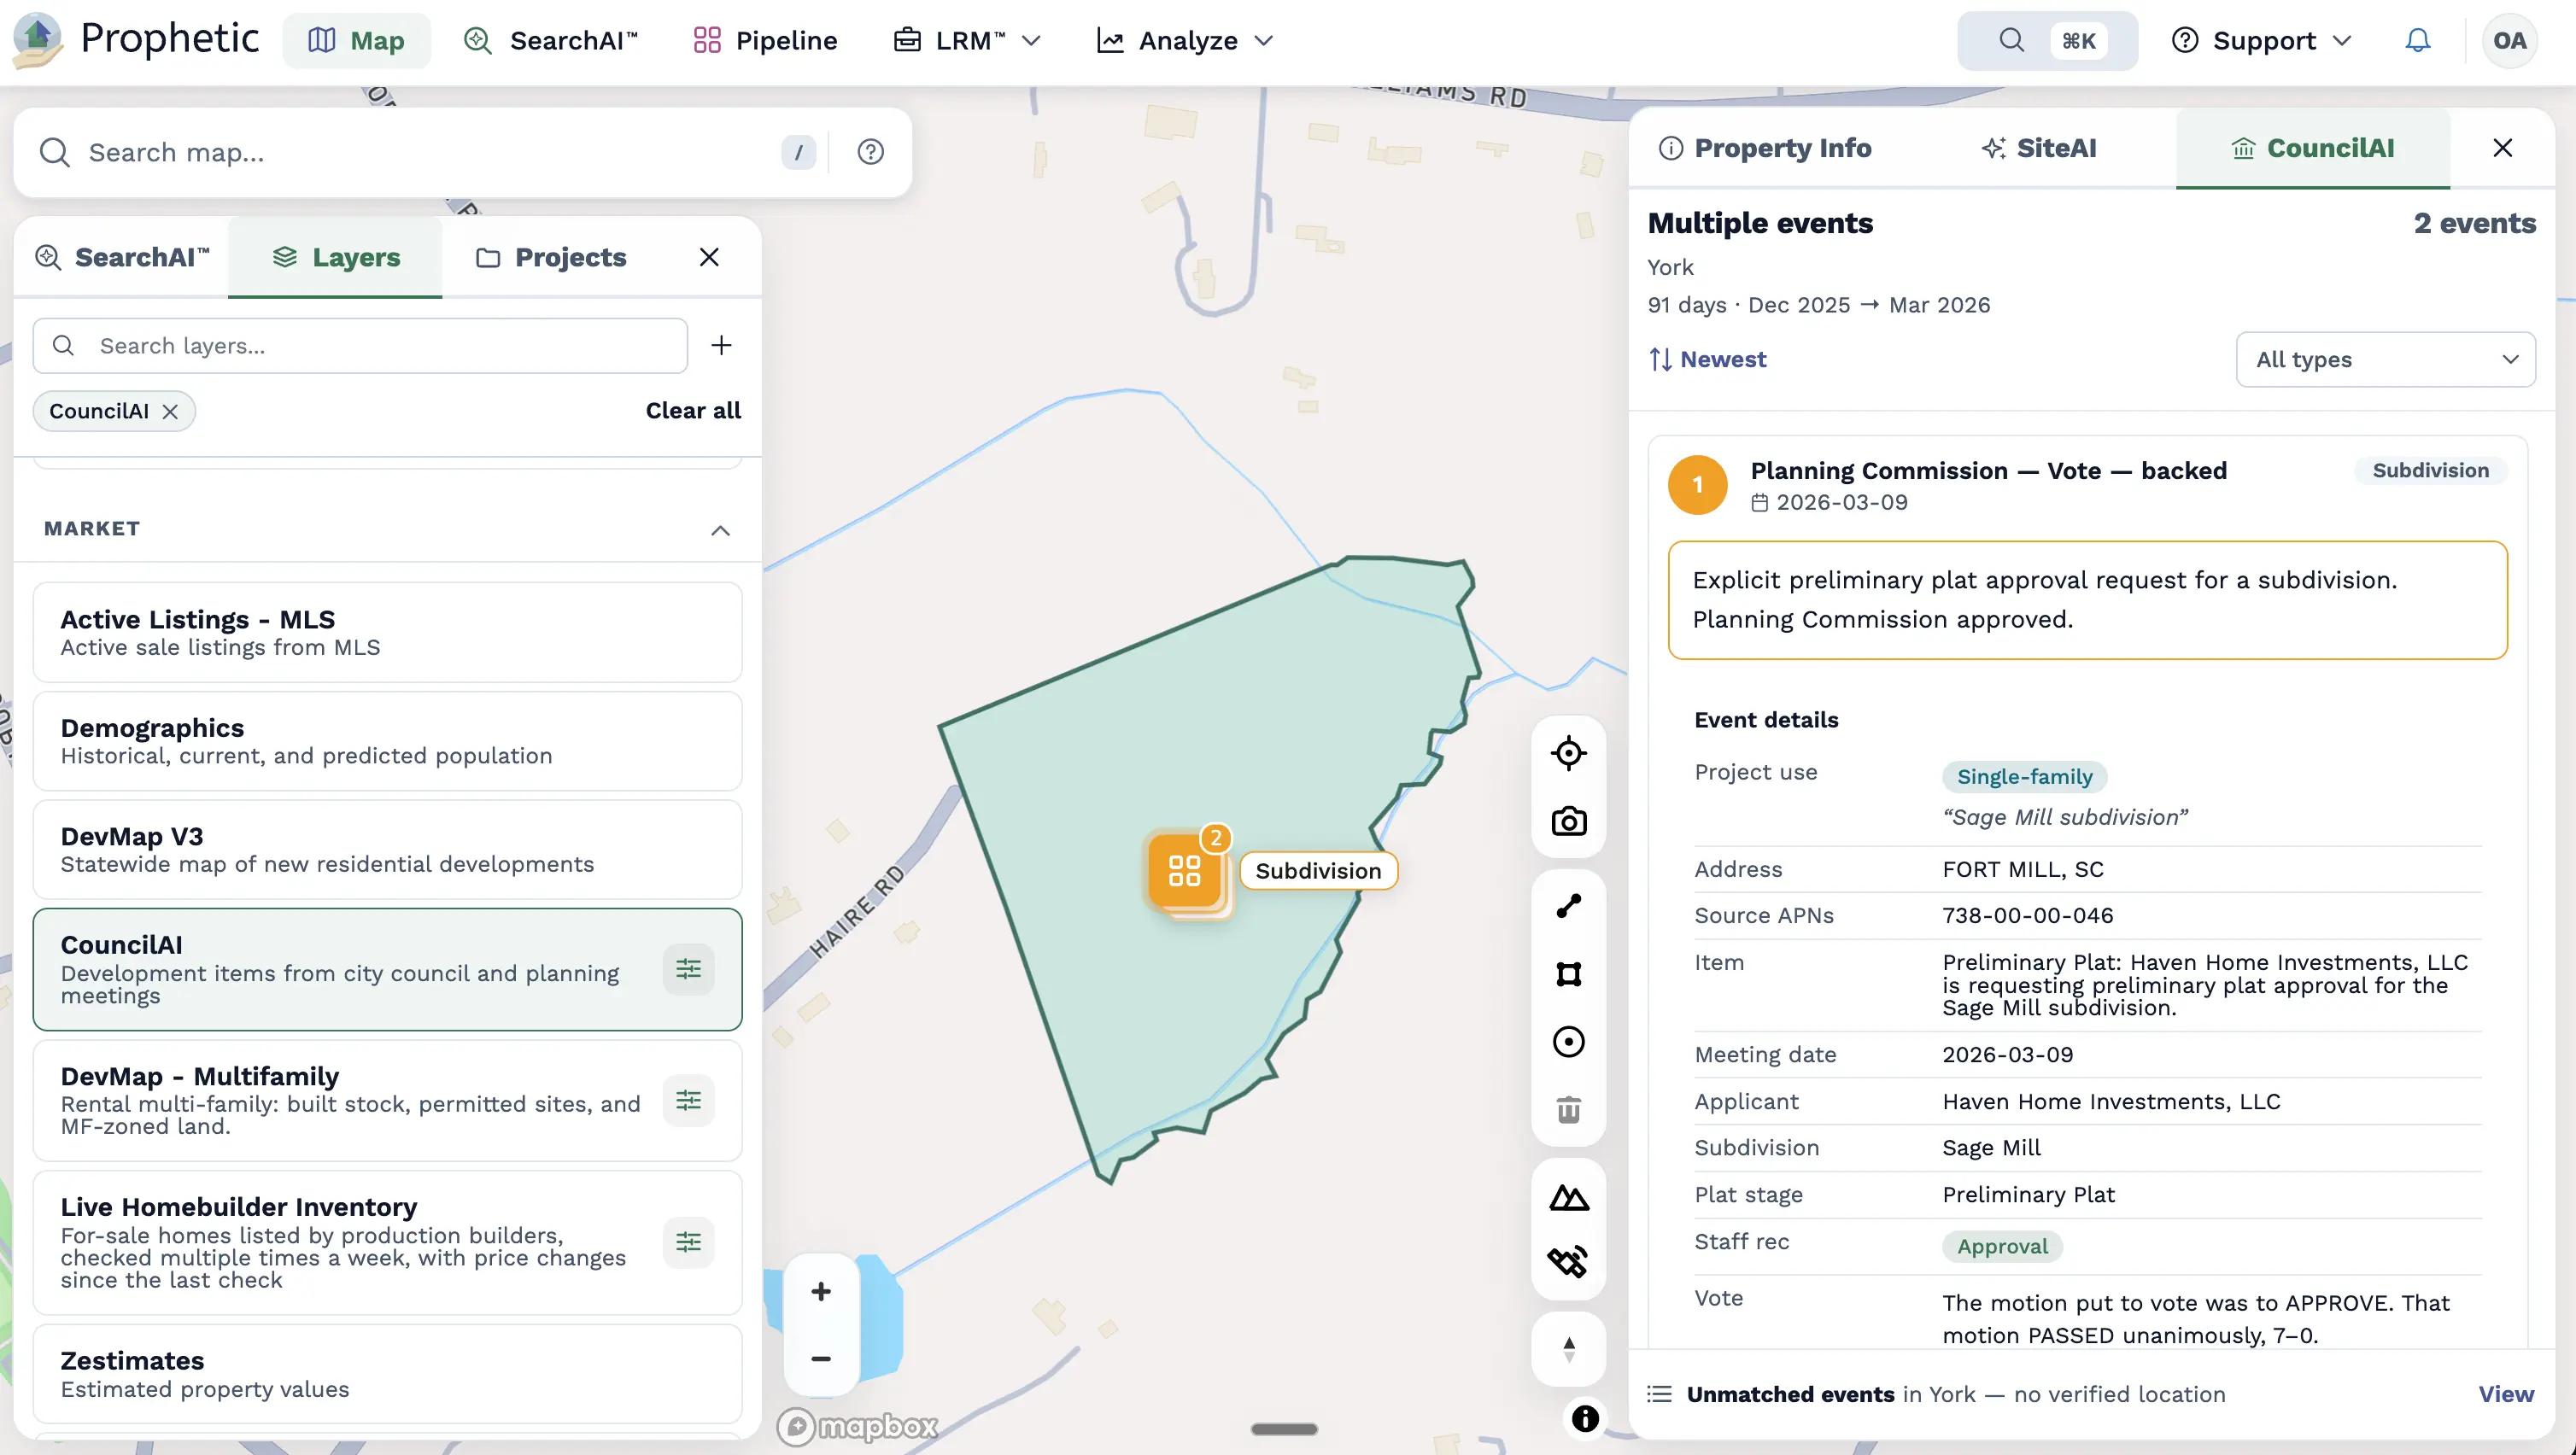
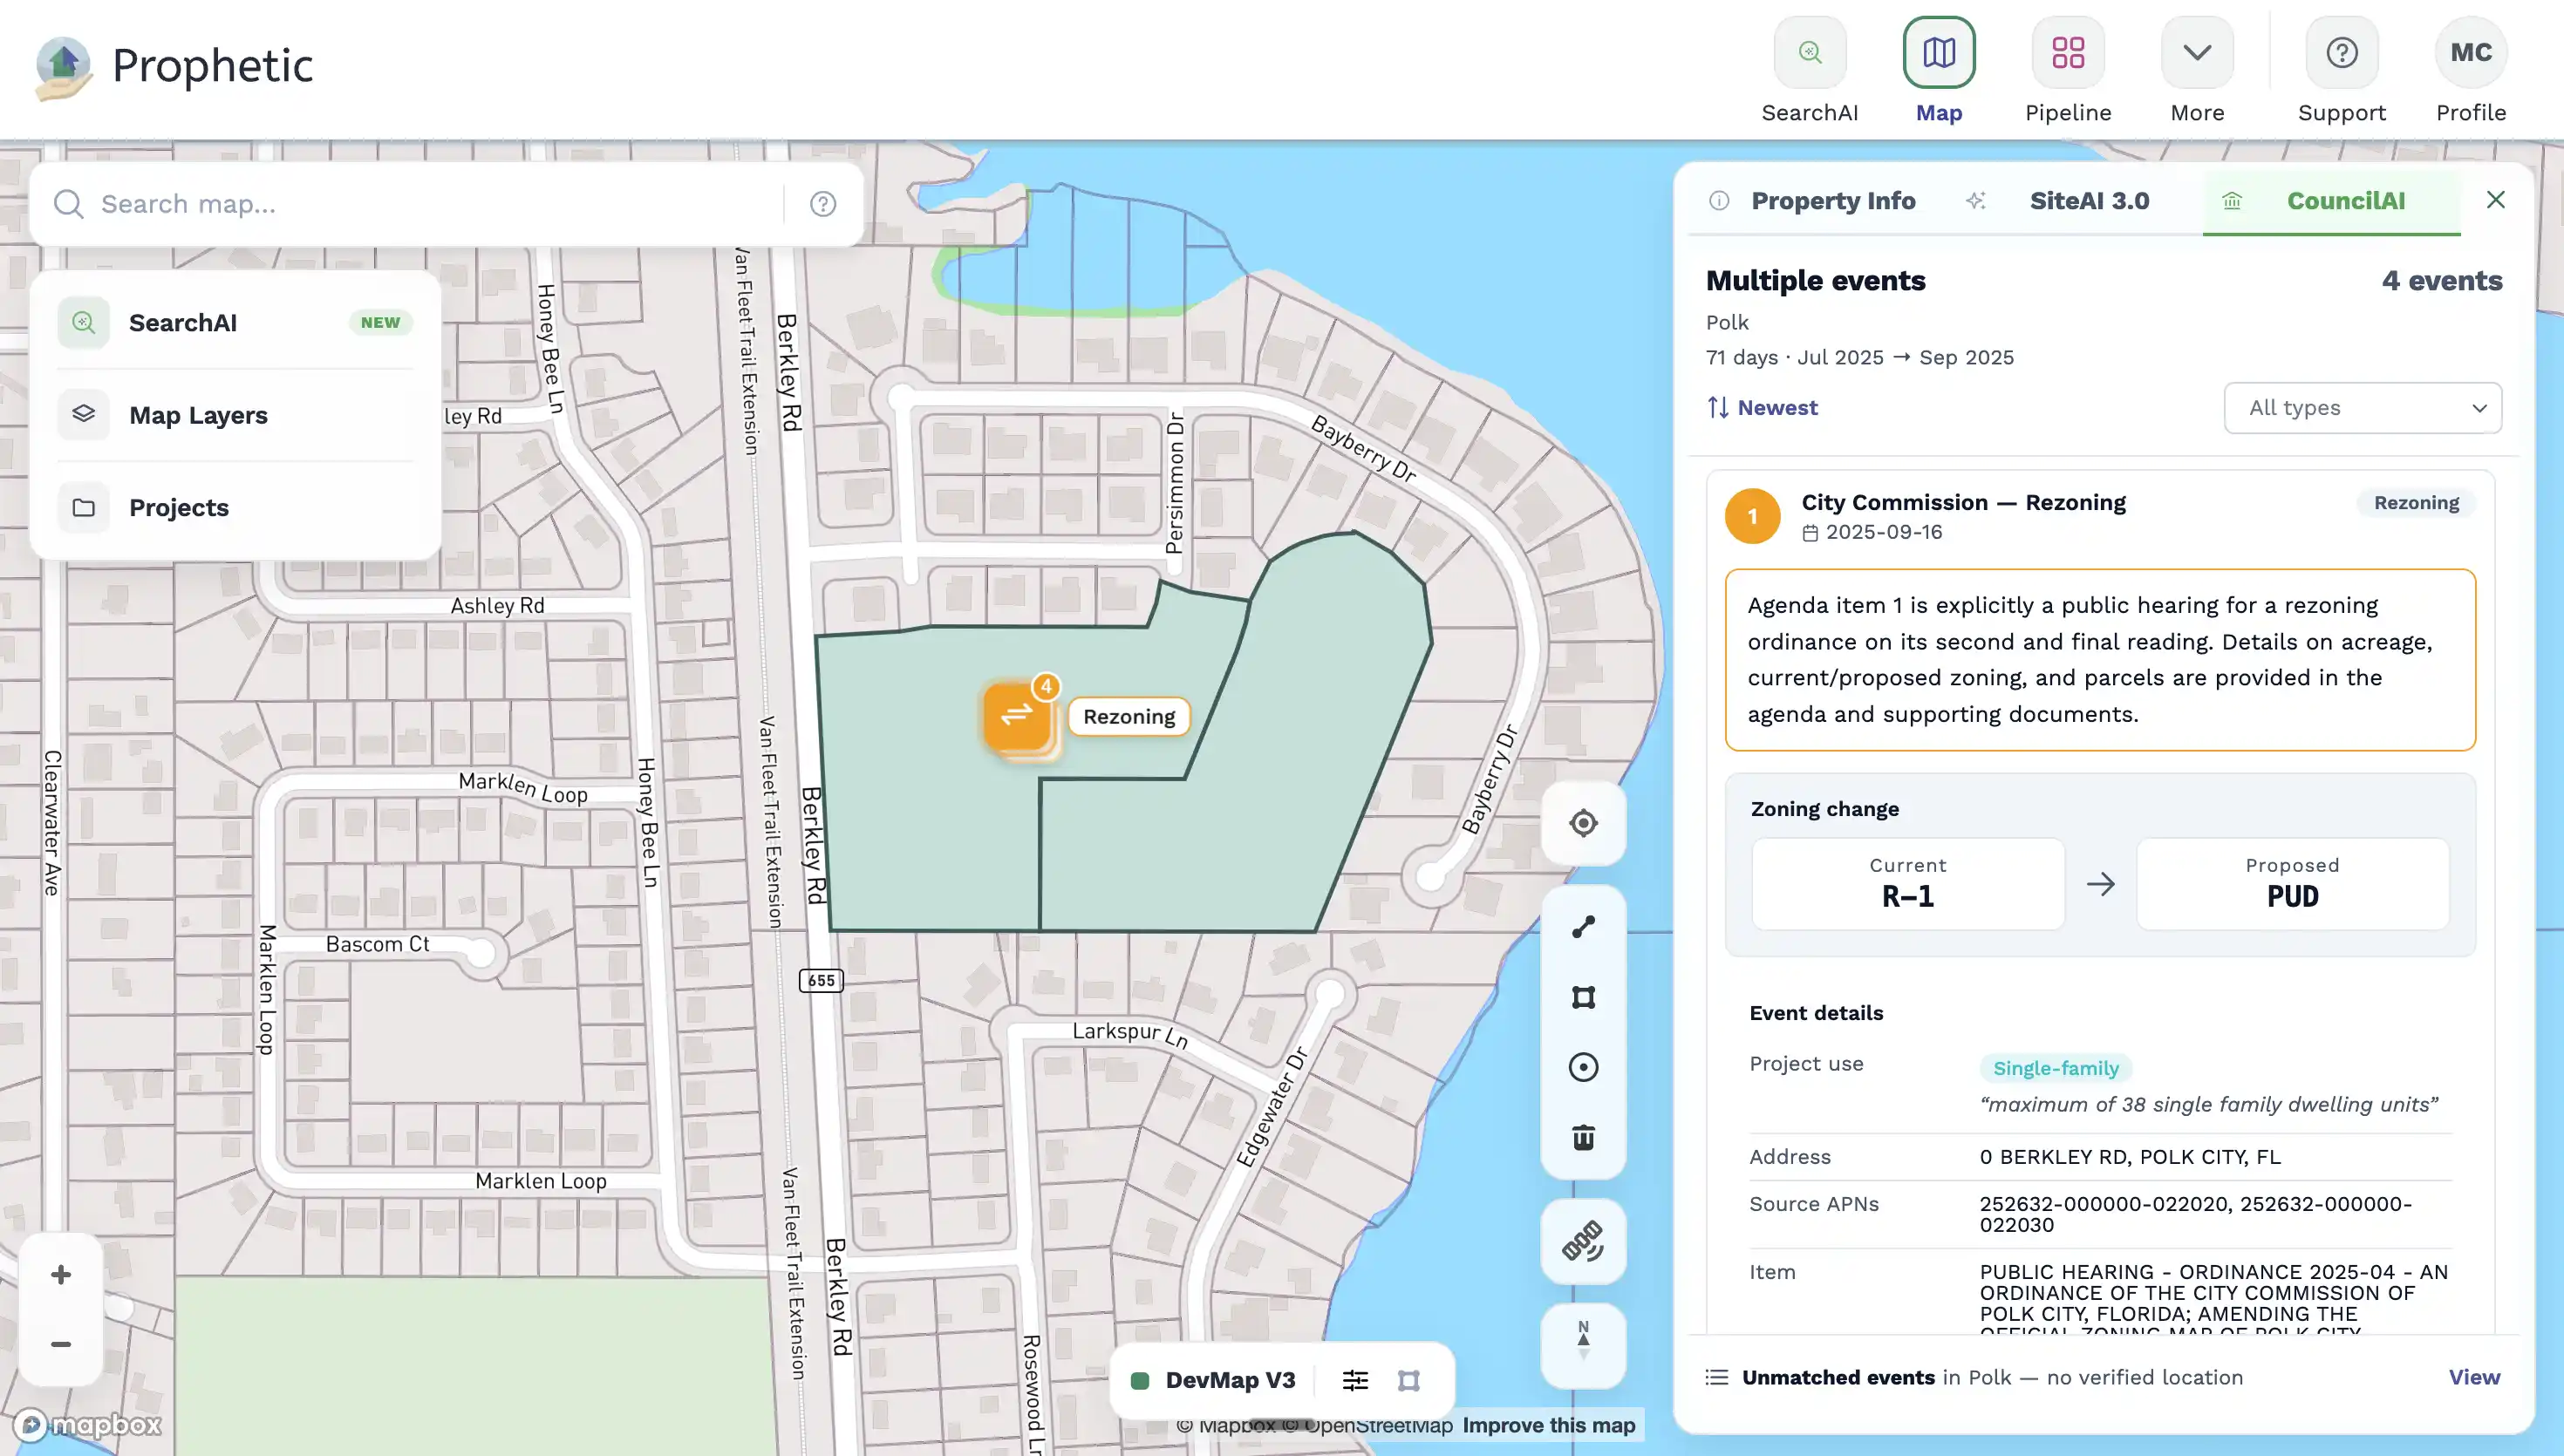
The first signal. Rezonings, subdivisions, and site plans from 3,500+ governing bodies, caught at their first public hearing.
DevMap™
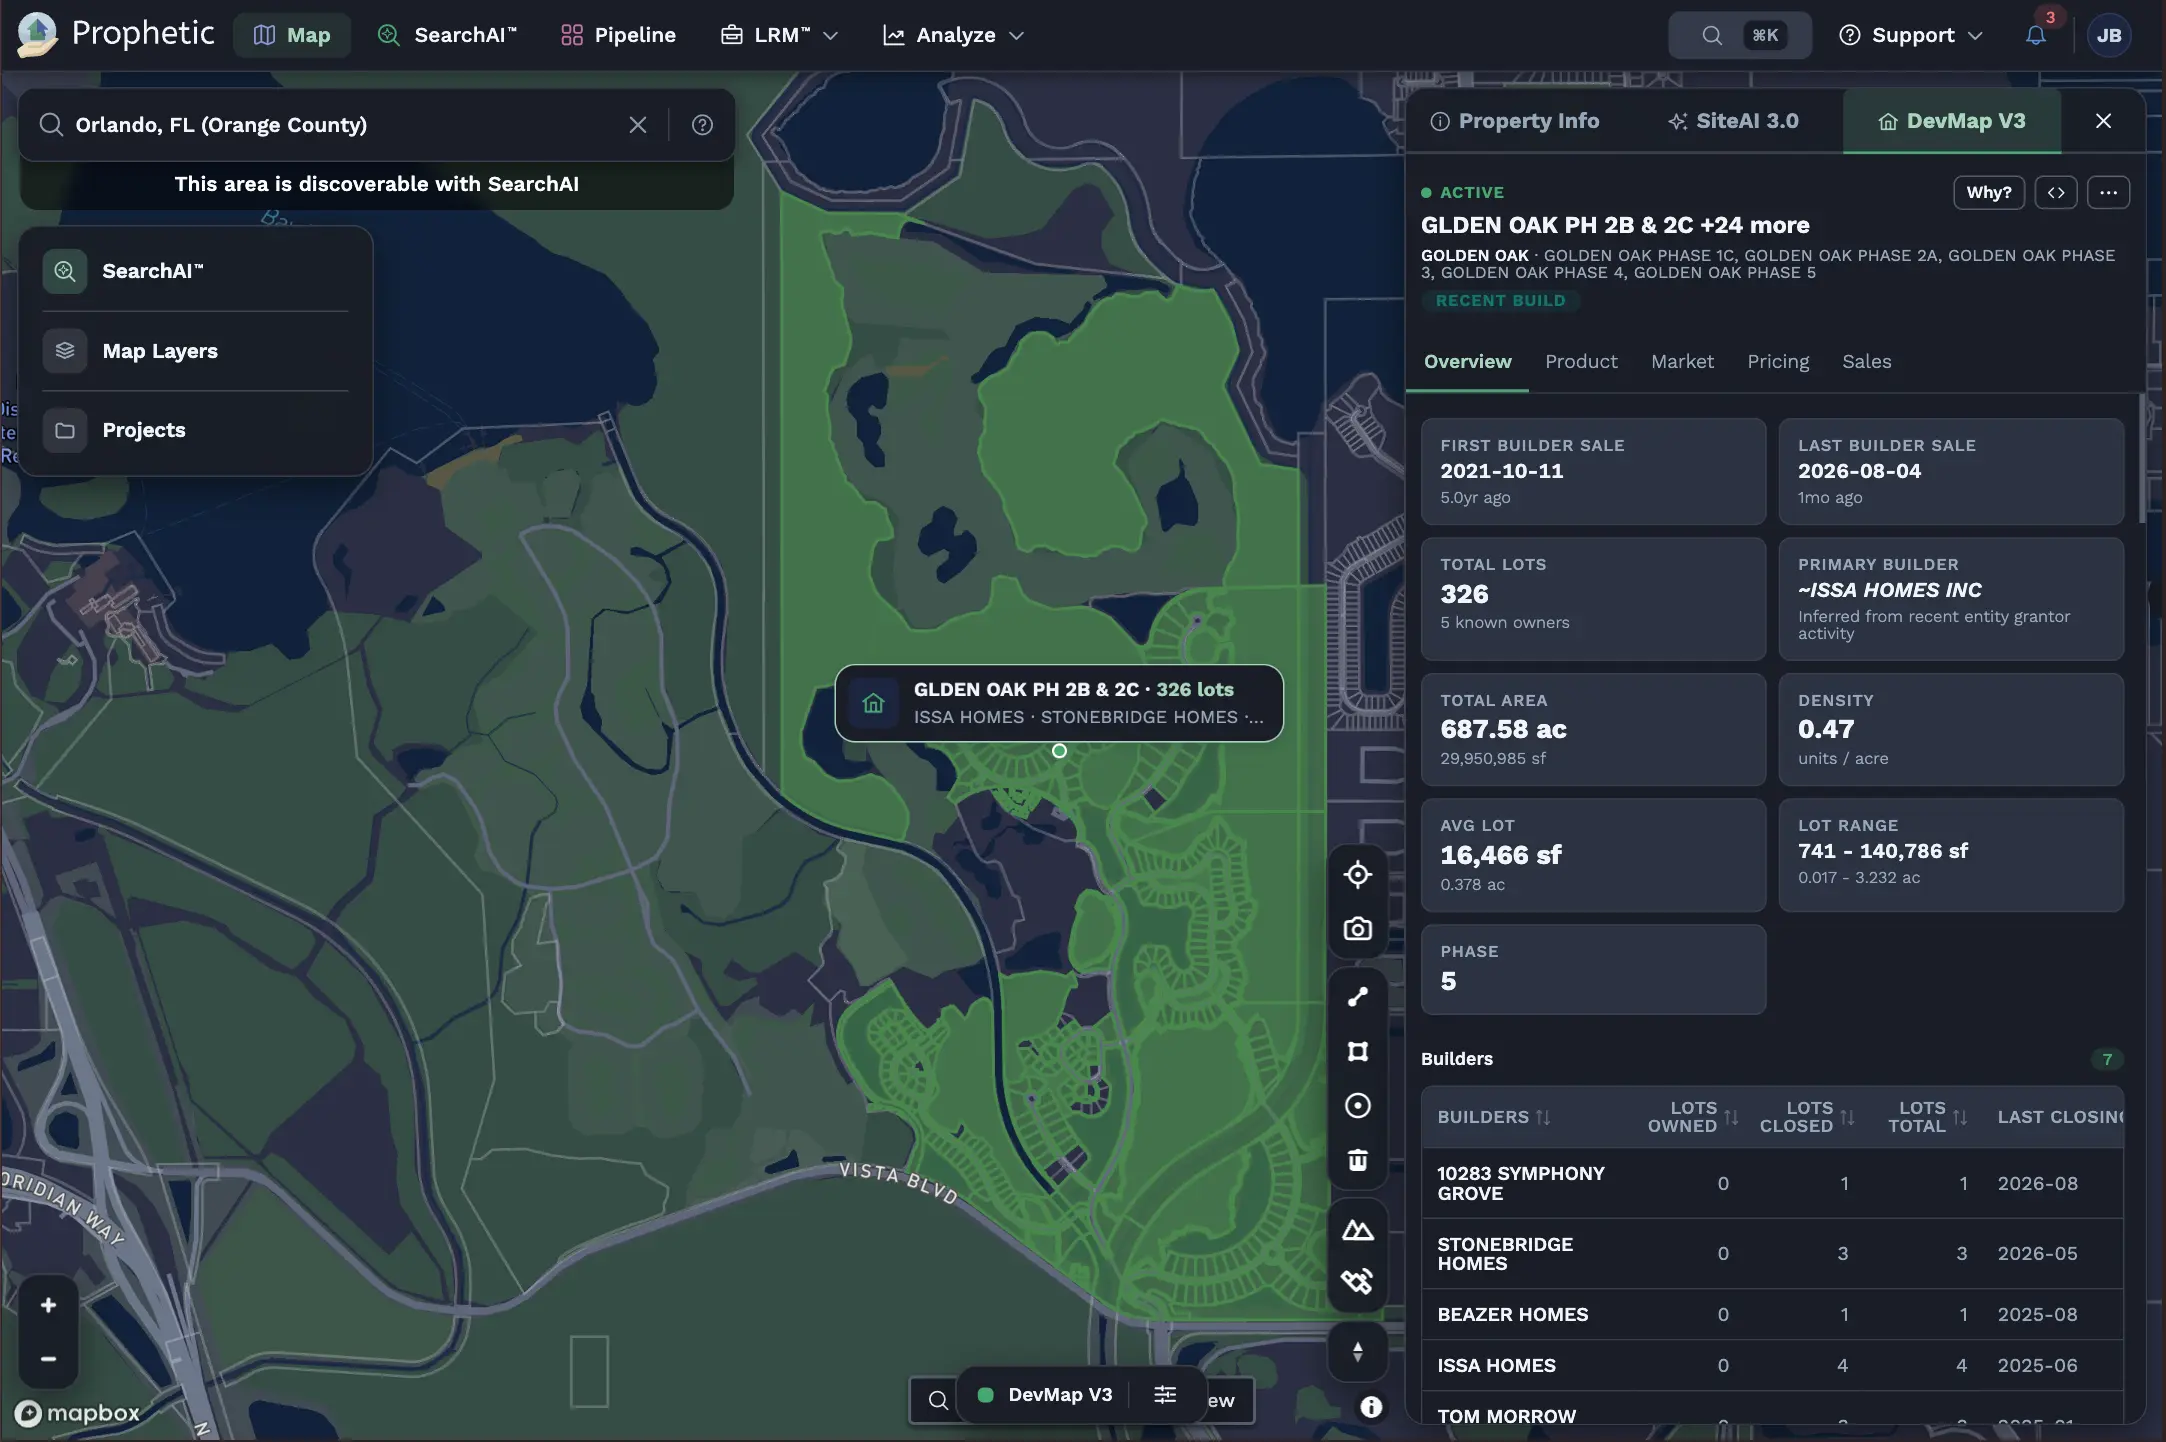
The full picture. 164,000+ subdivisions and 32,000+ multifamily projects, tracked from entitlement through completion.
Live Homebuilder Inventory
The live market. Asking prices, cuts, and incentives on 65,000+ for-sale new homes from the top 50+ homebuilder brands.
See growth corridors forming before land prices reflect it. Track specific competitors. Identify patterns that signal opportunity or saturation. Understand positioning before making offers.
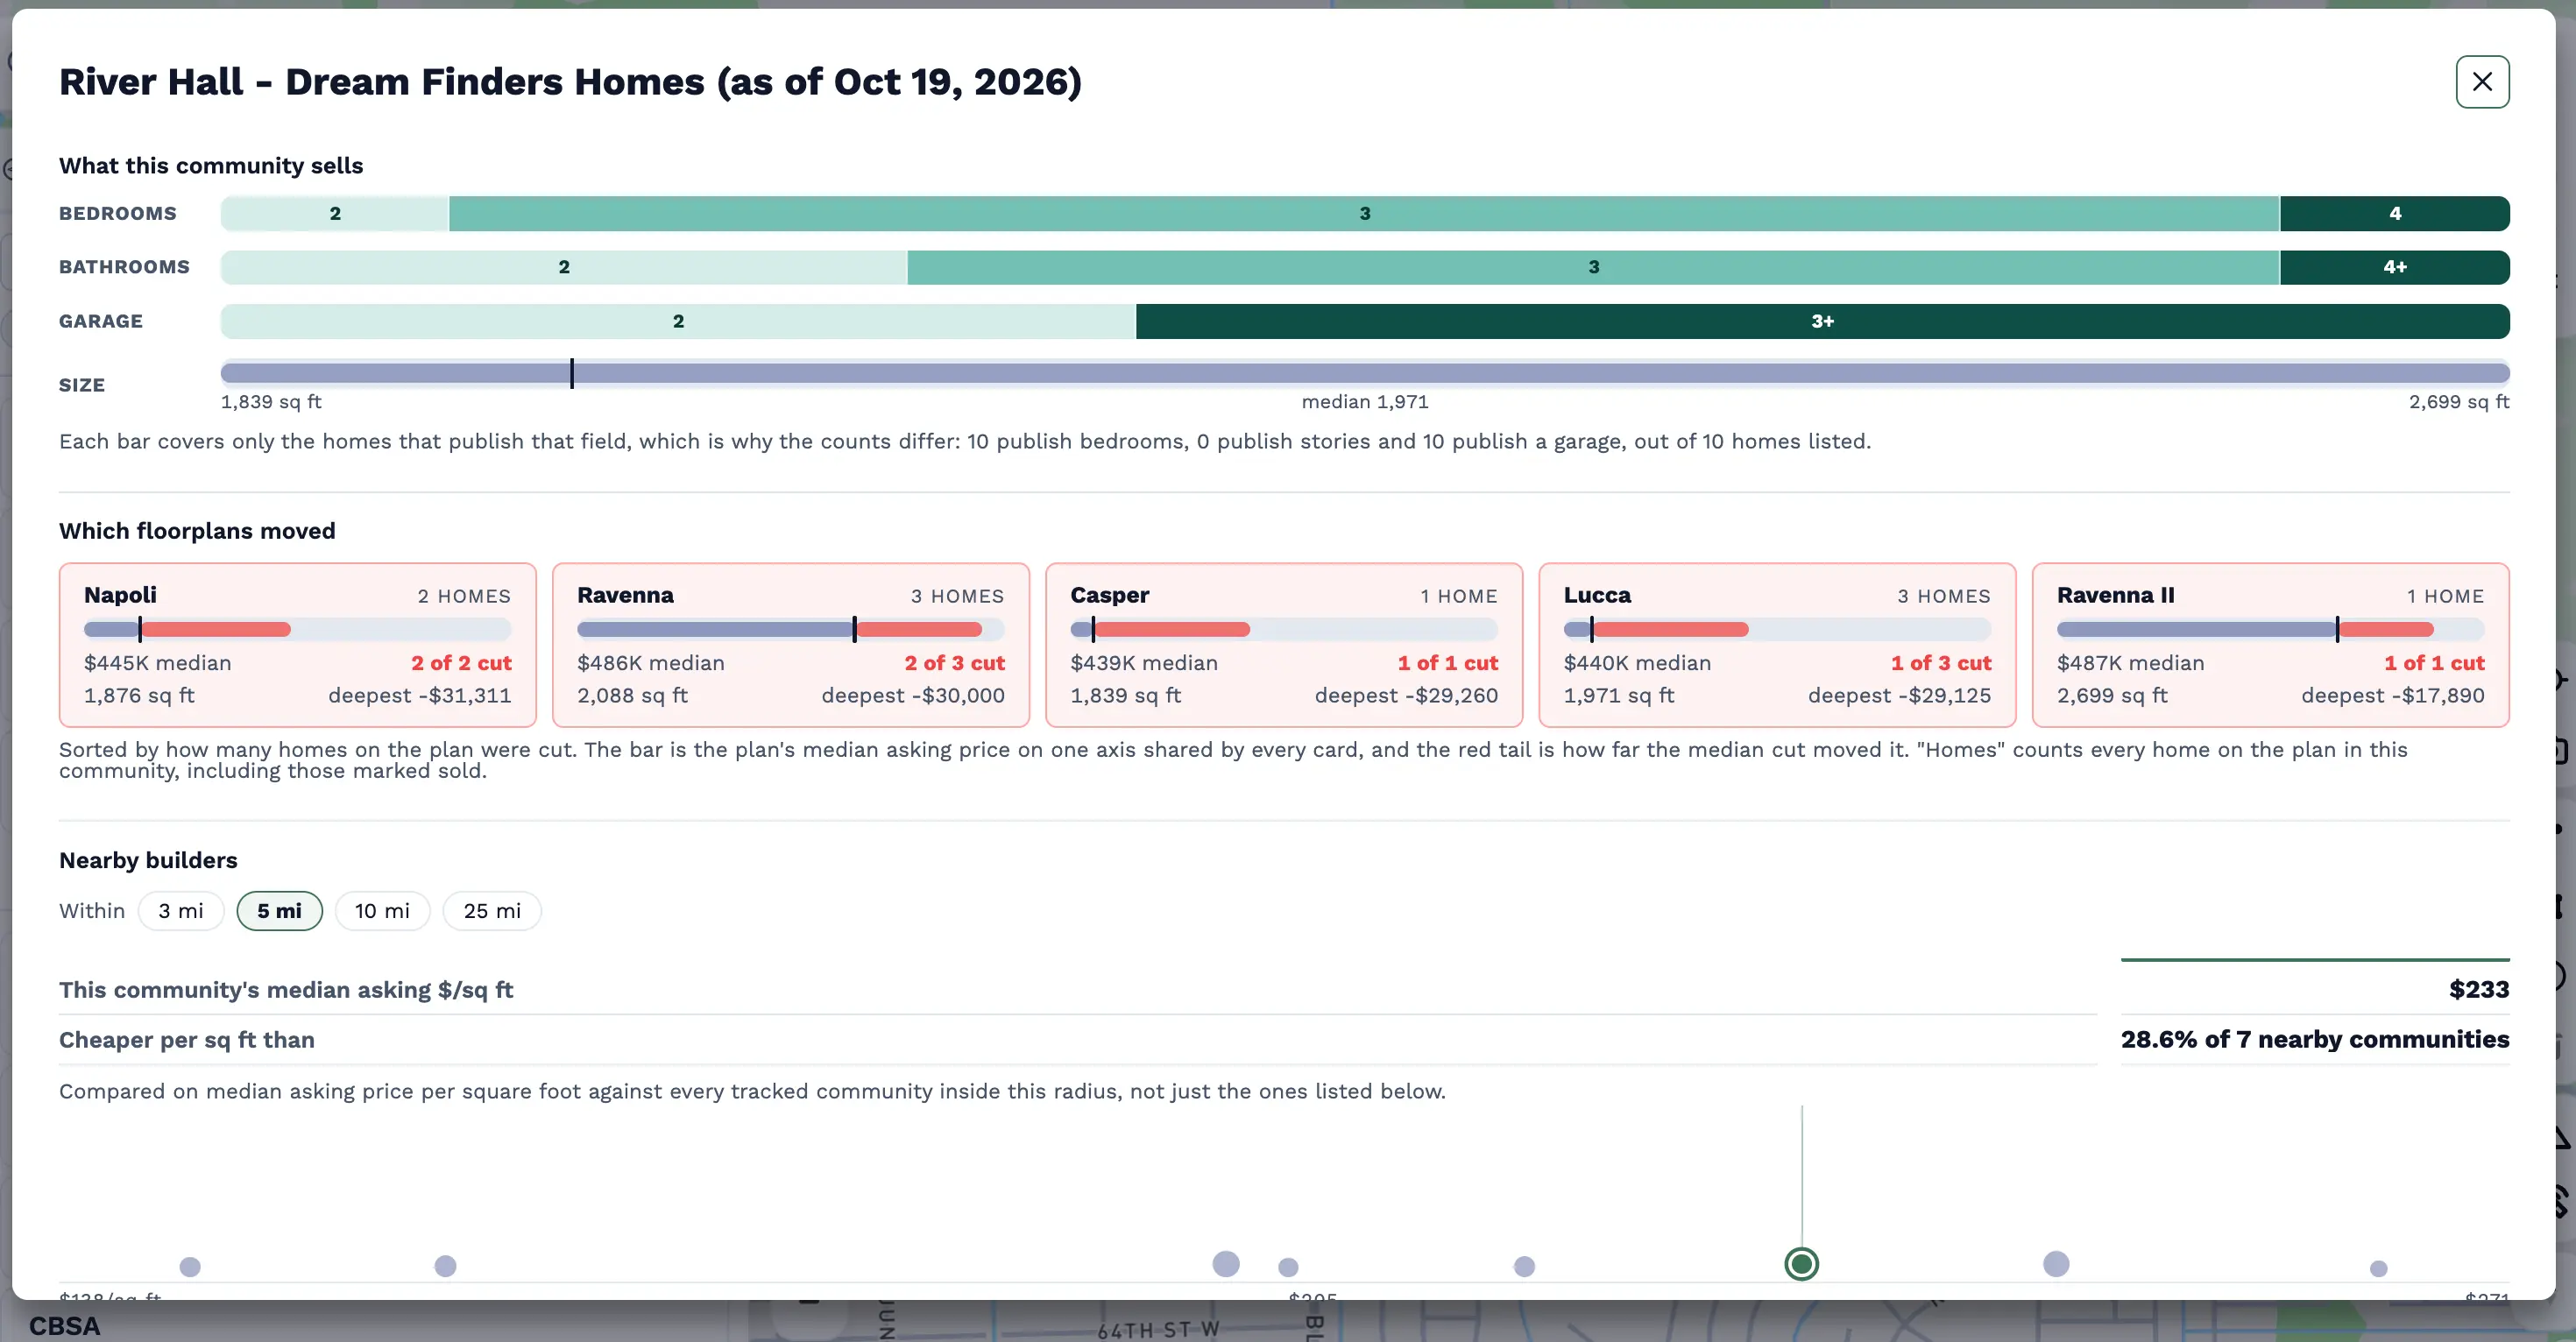


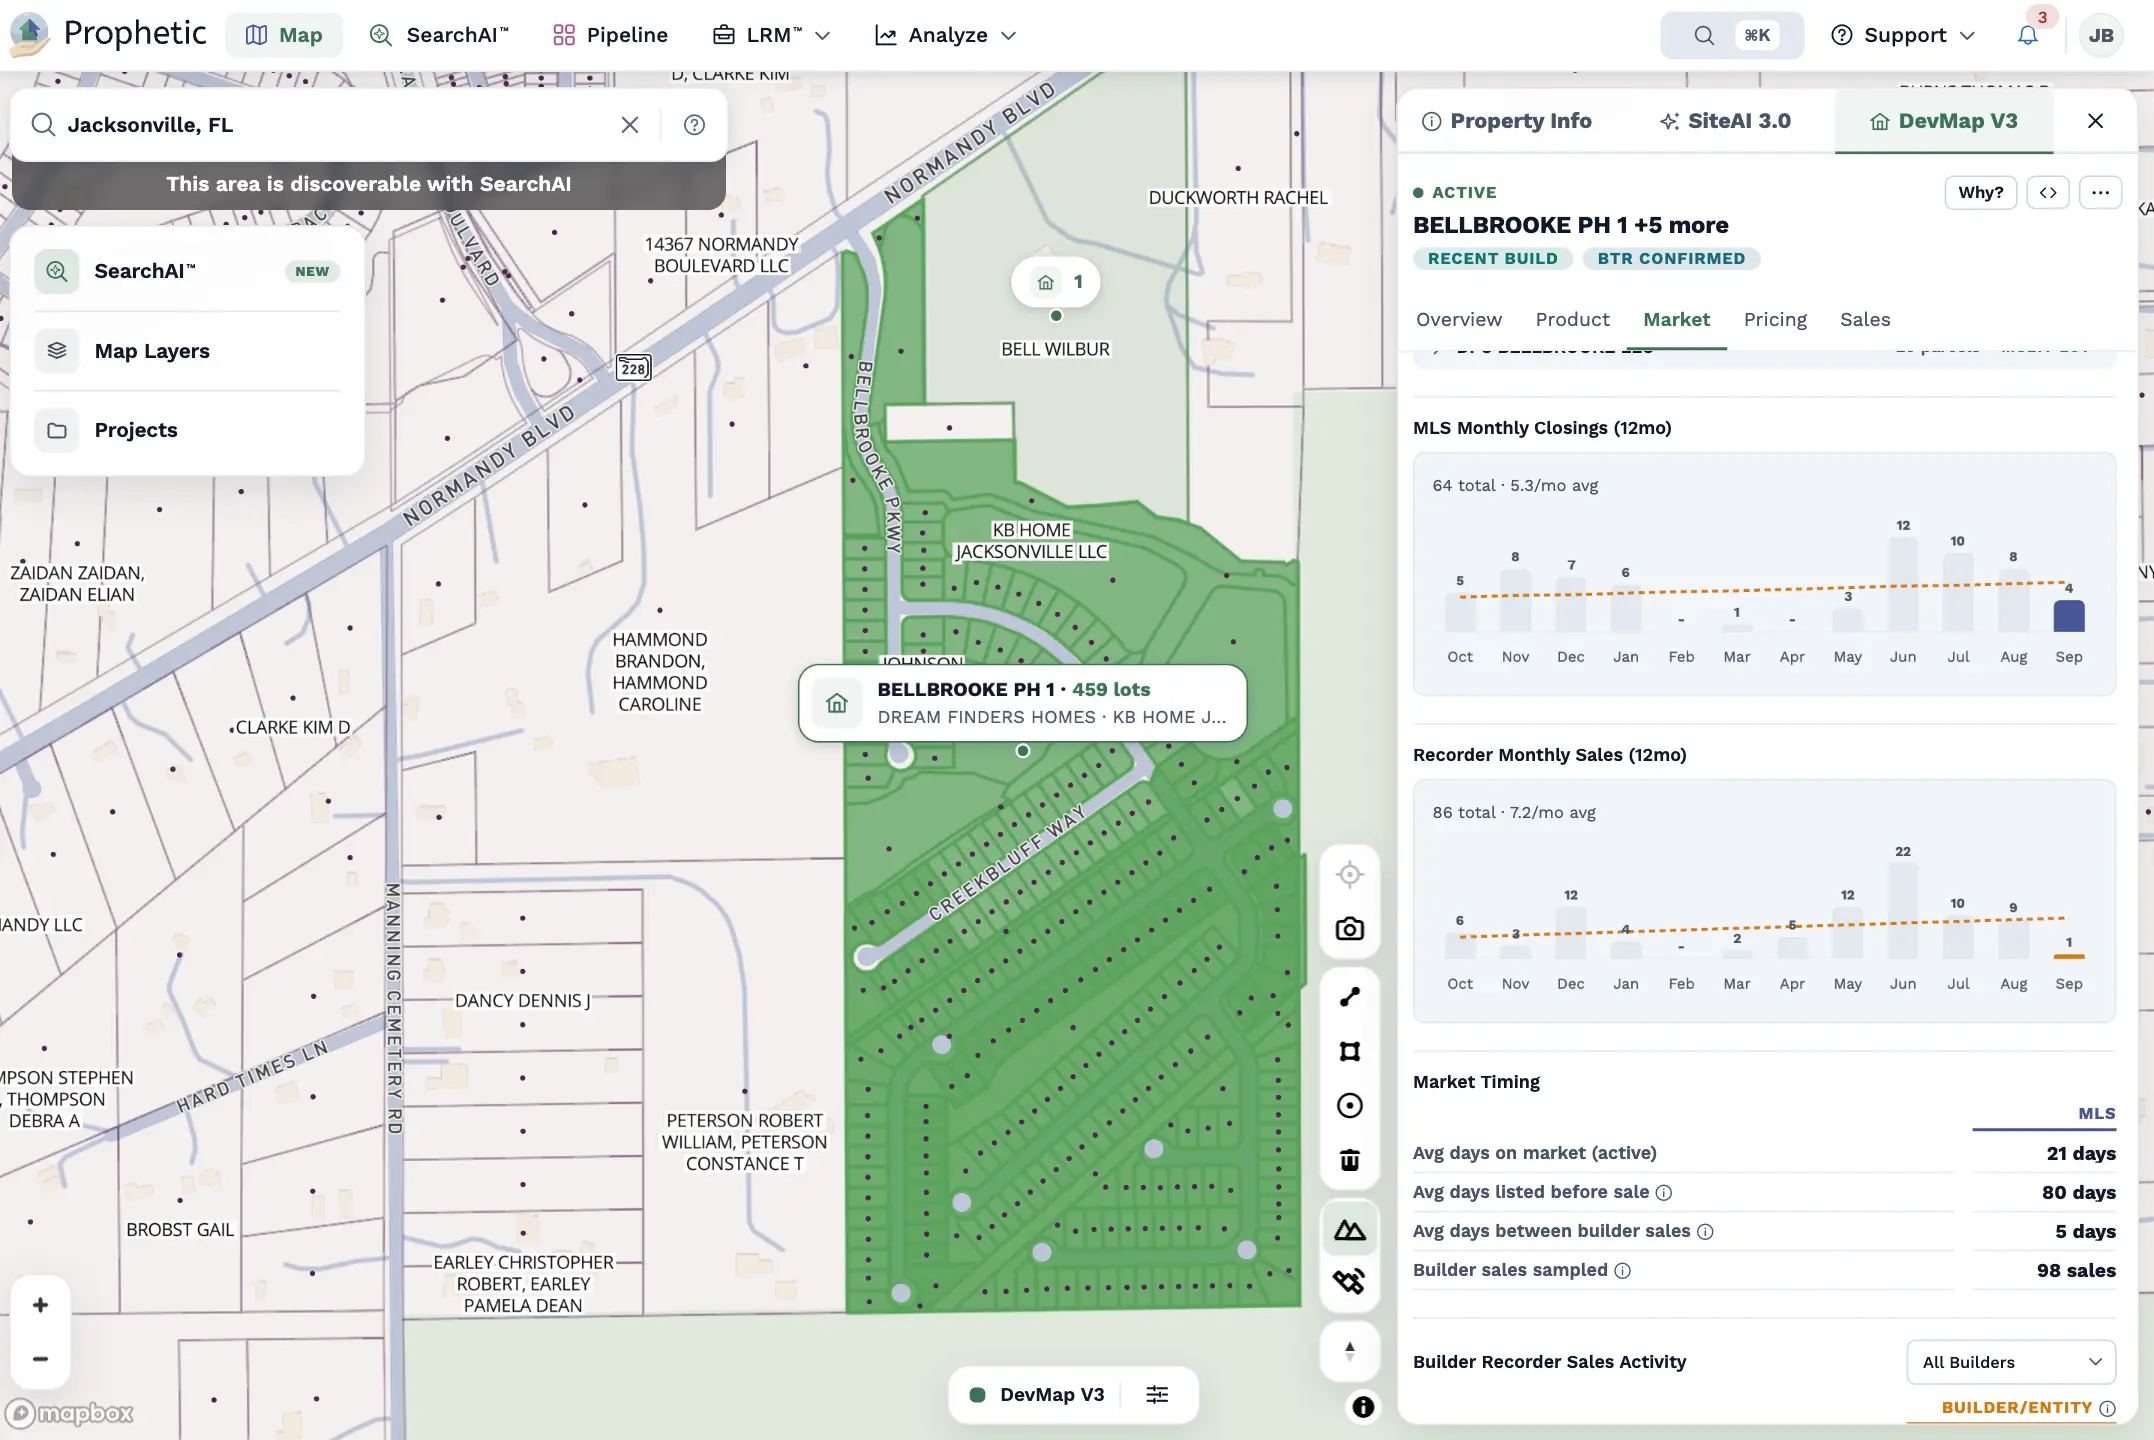
Absorption rates, pricing trends, live asking prices and incentives, days on market, and product mix for every development
Track who's building, what they're delivering, how they're pricing it this week, and how it's selling across all markets
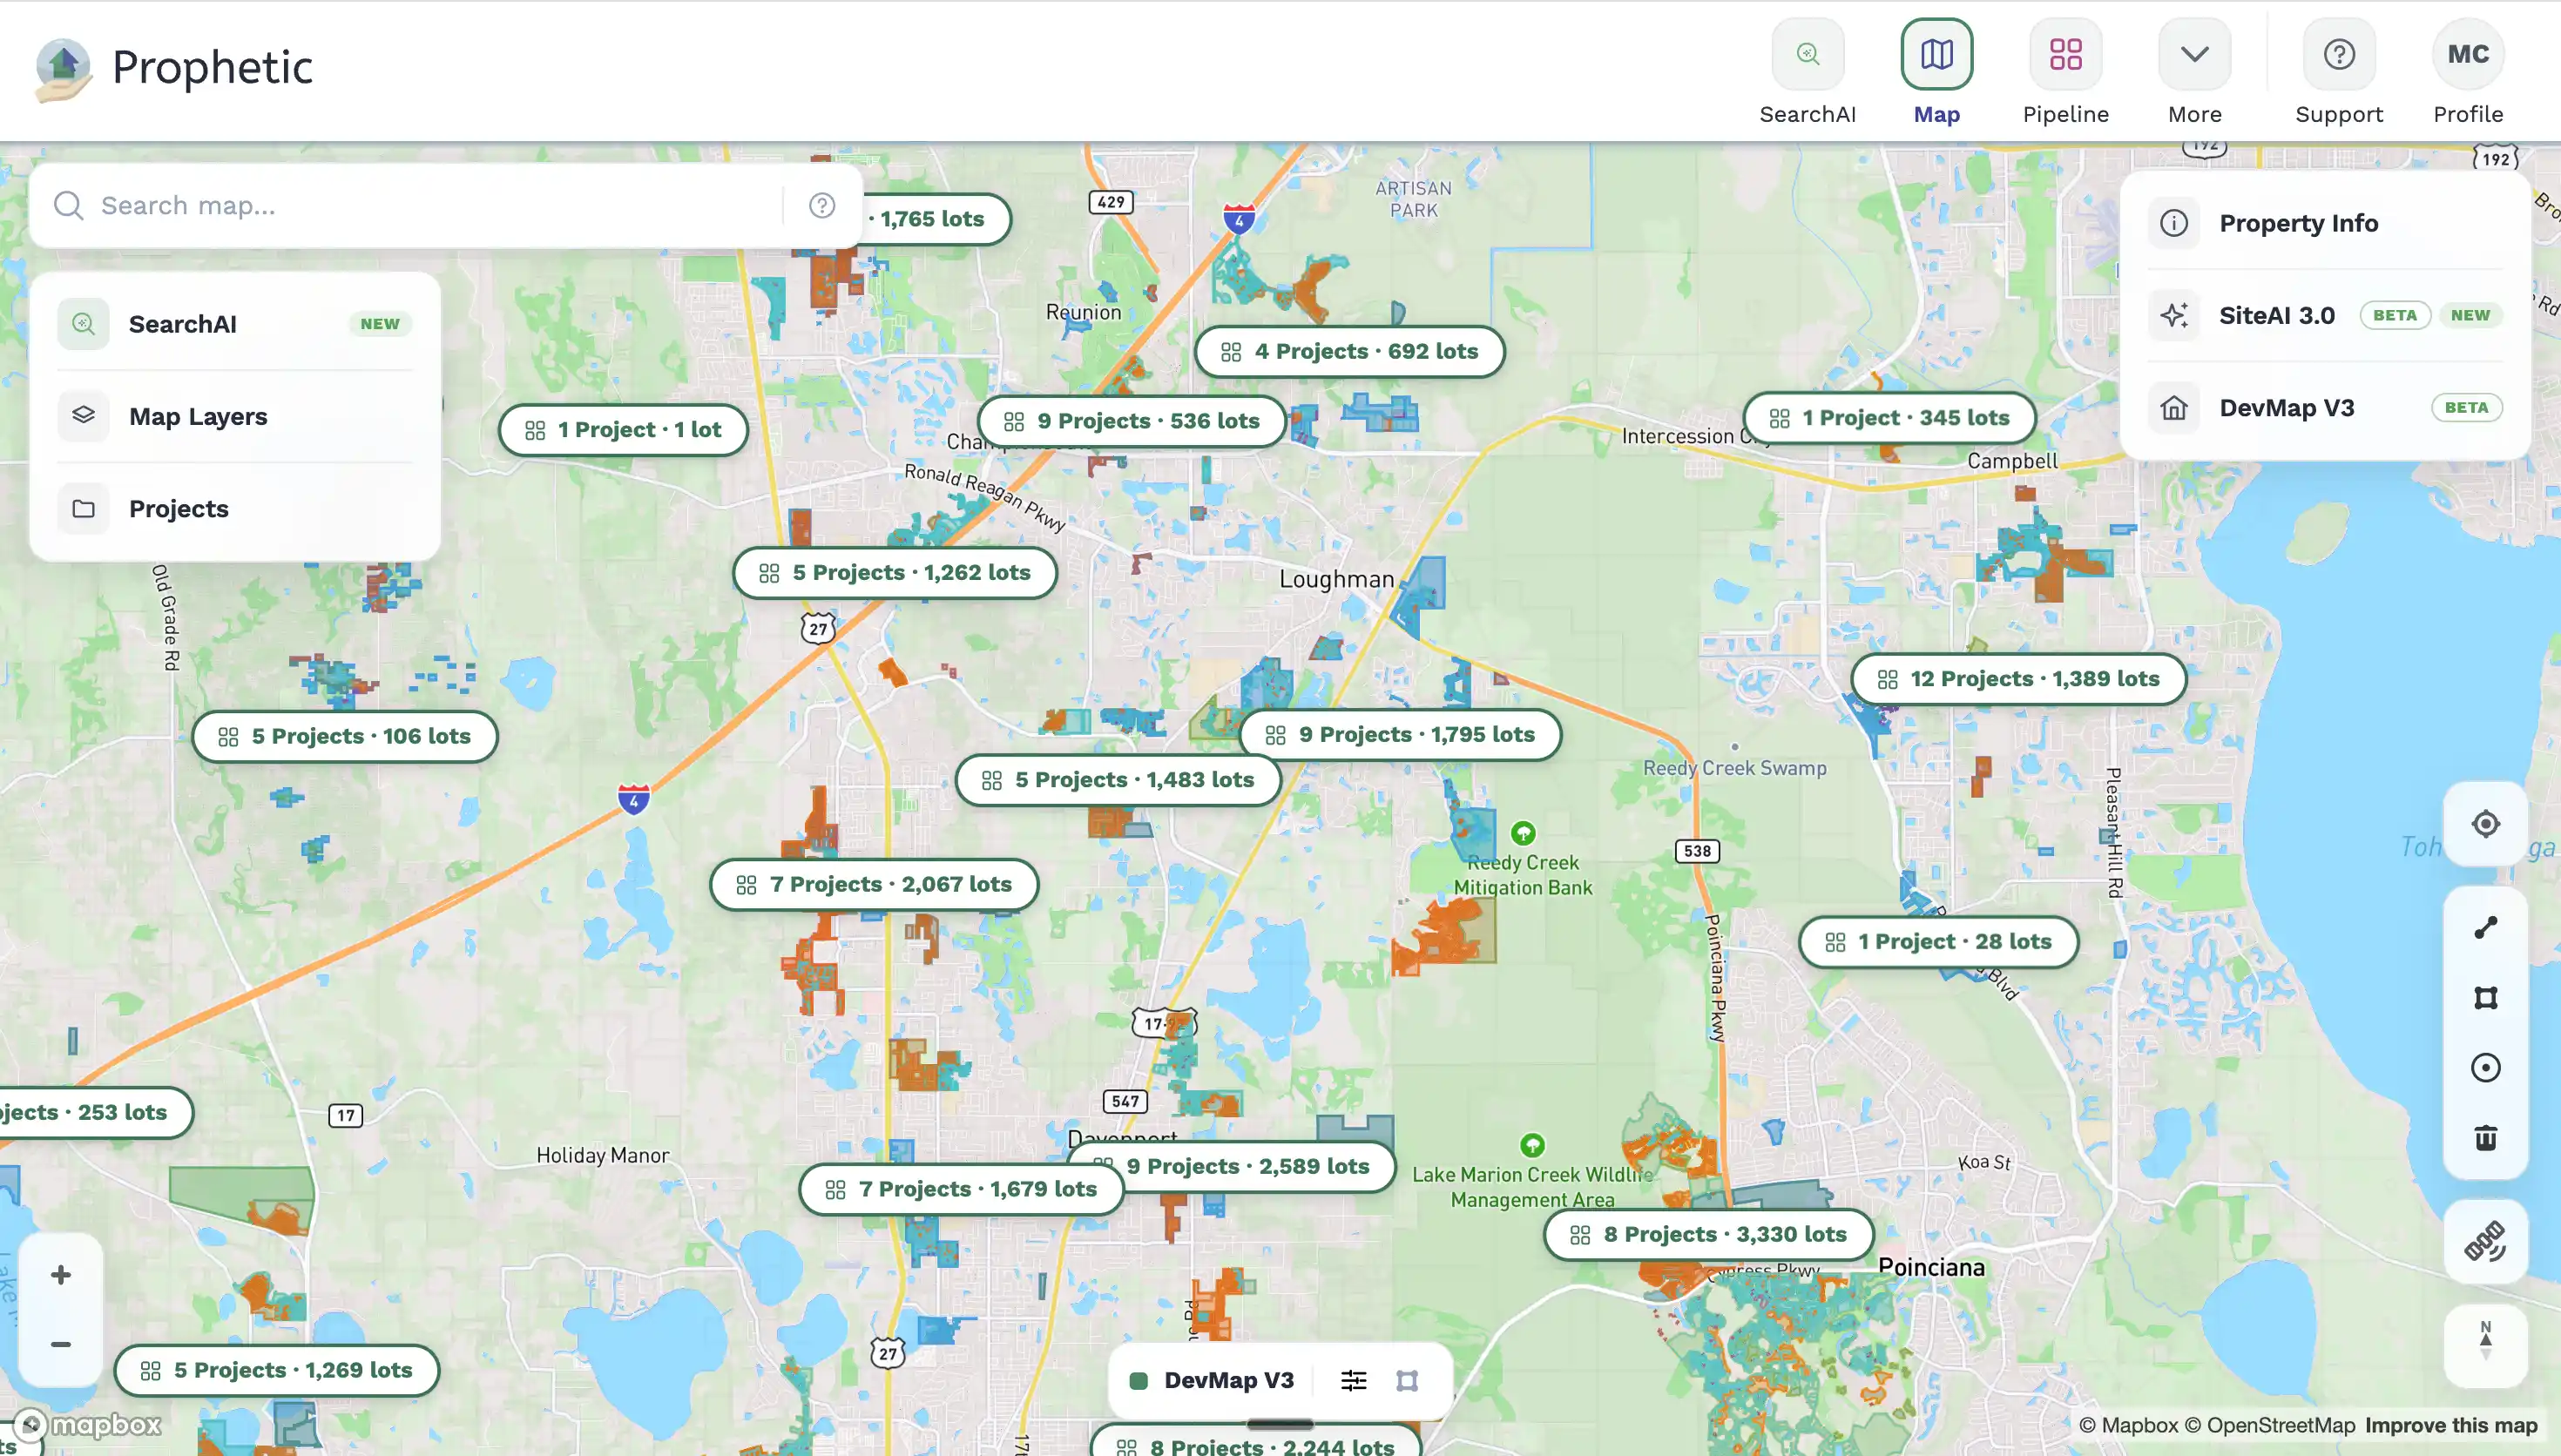
See the full supply pipeline, from rezonings at their first hearing to projects nearing completion, plus saturation signals and emerging corridors before they're obvious
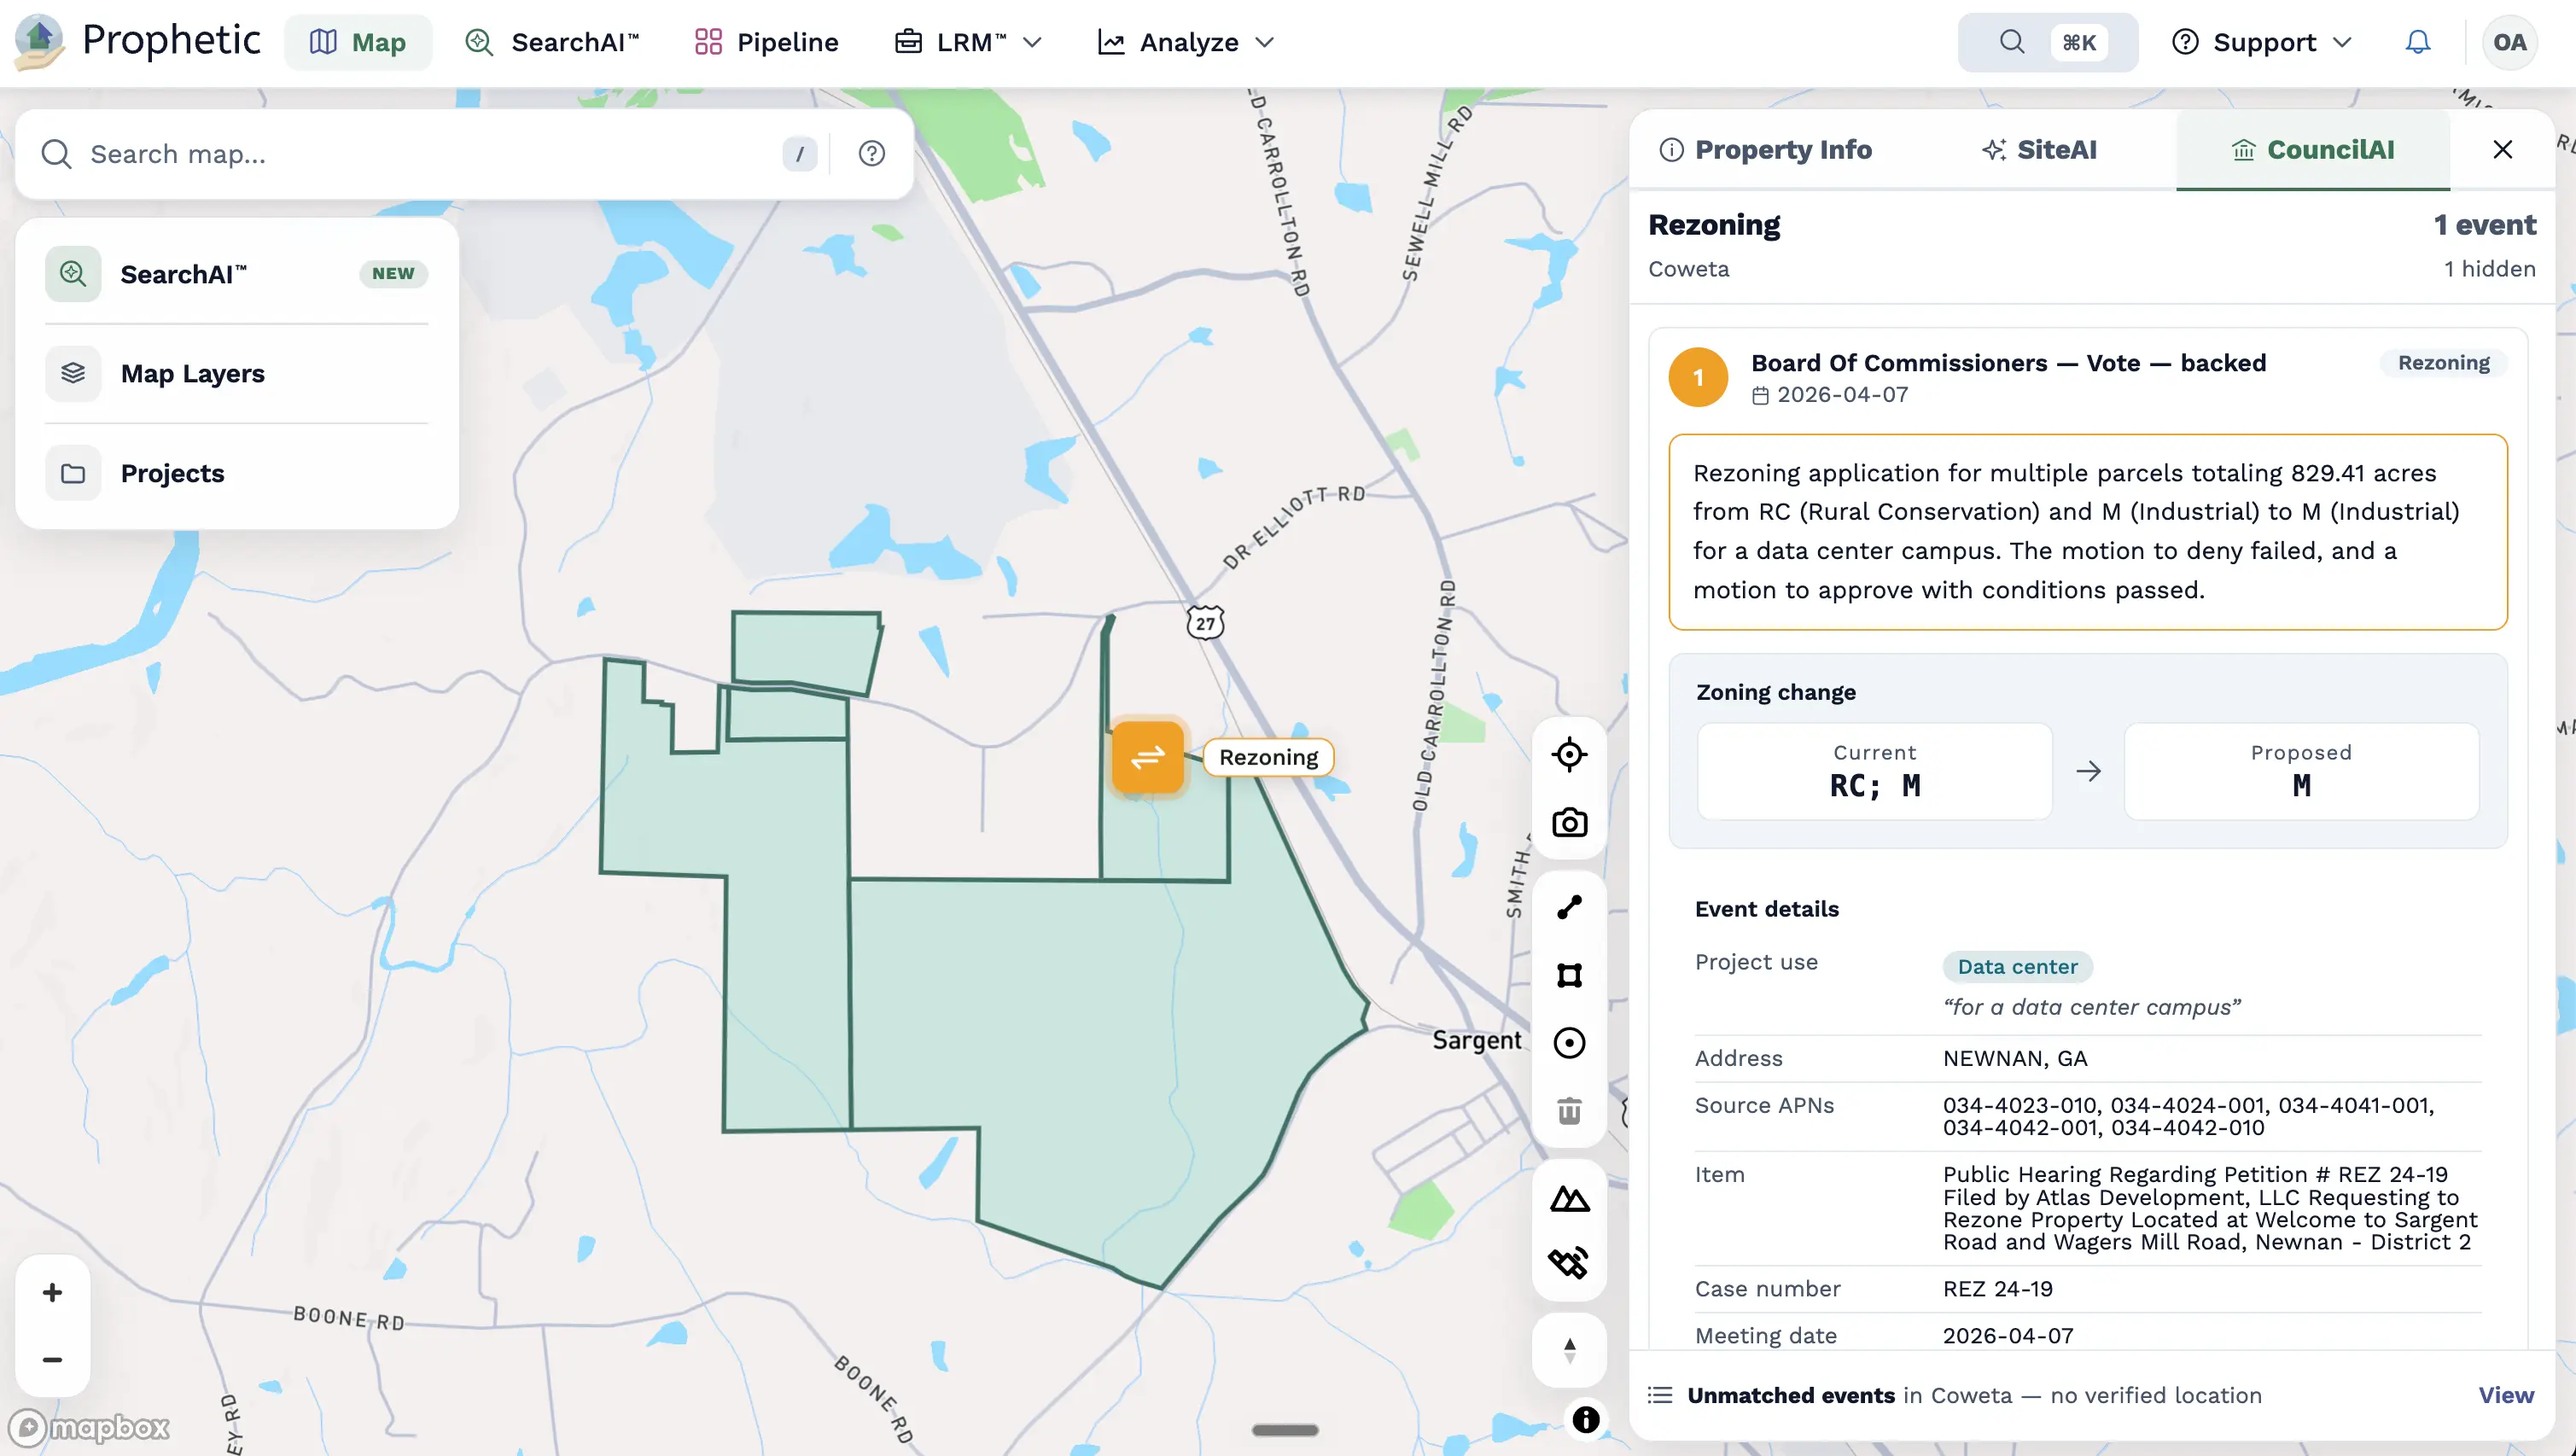
Rezonings, annexations, subdivisions, and site plans from public meetings, pinned to the parcel they affect and linked to the source document


