


If you lead land acquisition across multiple divisions, you already know the problem. Your teams are out there every day, running searches, tracking deals, analyzing parcels, building landowner relationships. The activity is happening. You just have no way to see it without picking up the phone.
The weekly status call. The emailed pipeline export that's already stale. The self-reported spreadsheet that only tells you what someone chose to share. These aren't processes. They're workarounds.
That changes with the Executive Dashboard.
What It Does
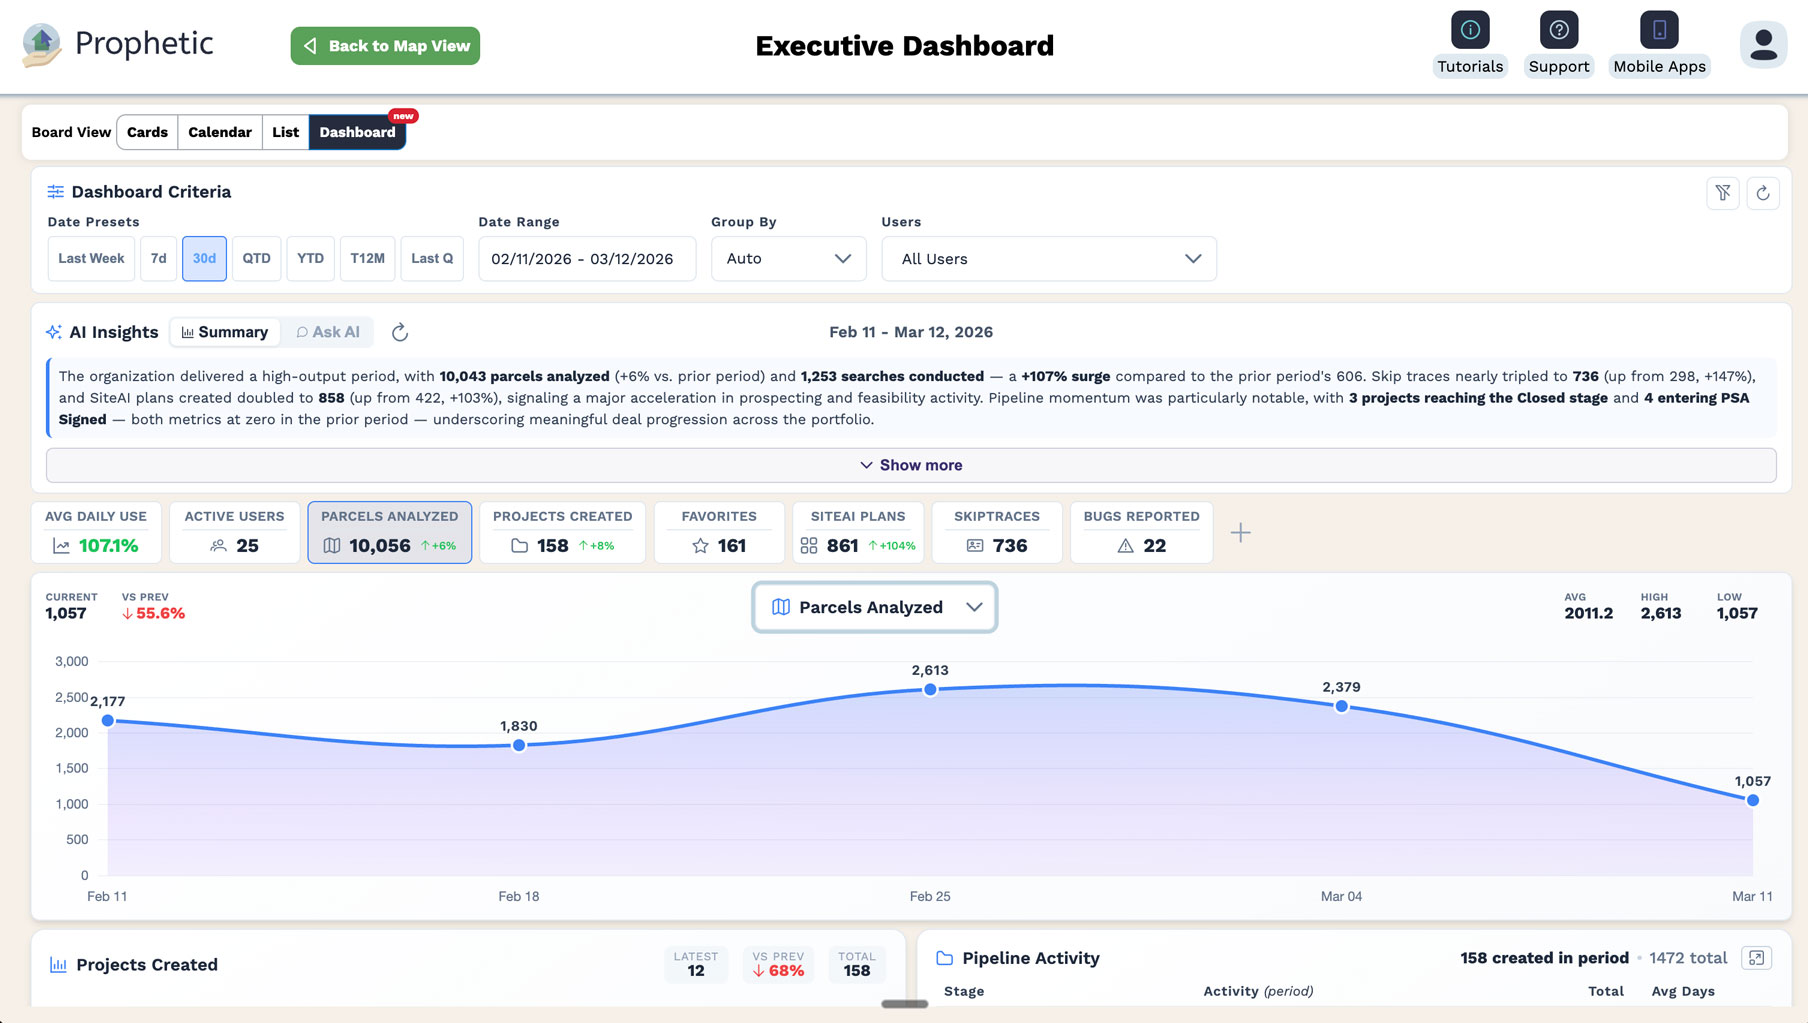
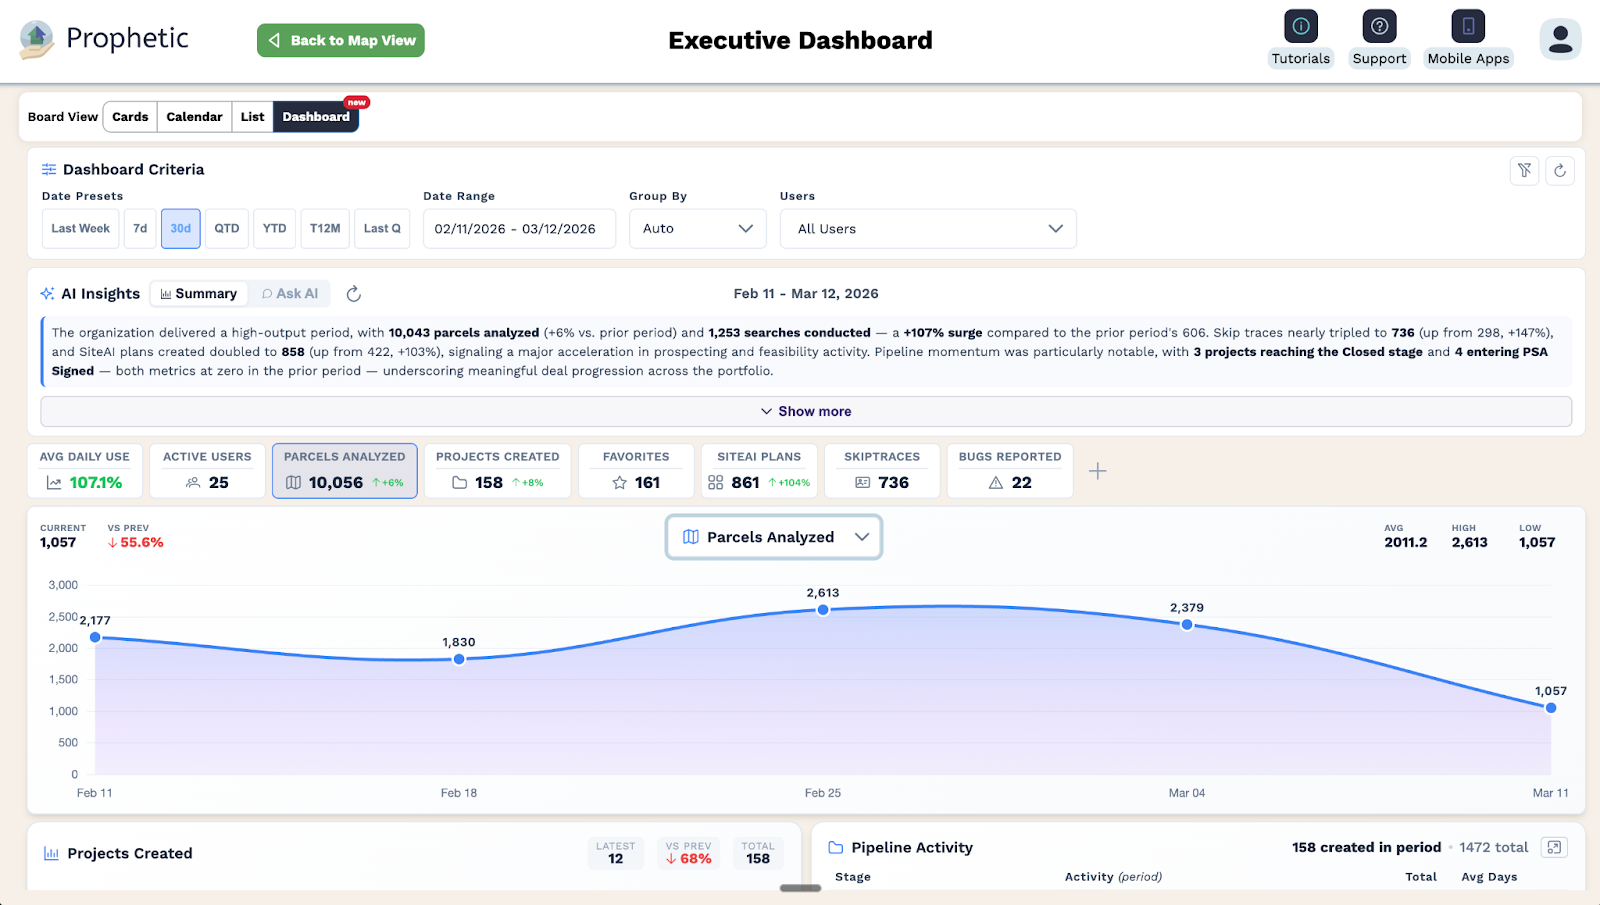
The Executive Dashboard adds a corporate-level visibility layer to Prophetic. For the first time, enterprise leaders with multi-division or multi-organization access can see the activity, engagement, and pipeline health of every team from a single screen, in real time, without switching accounts, without running exports, and without asking anyone for an update.
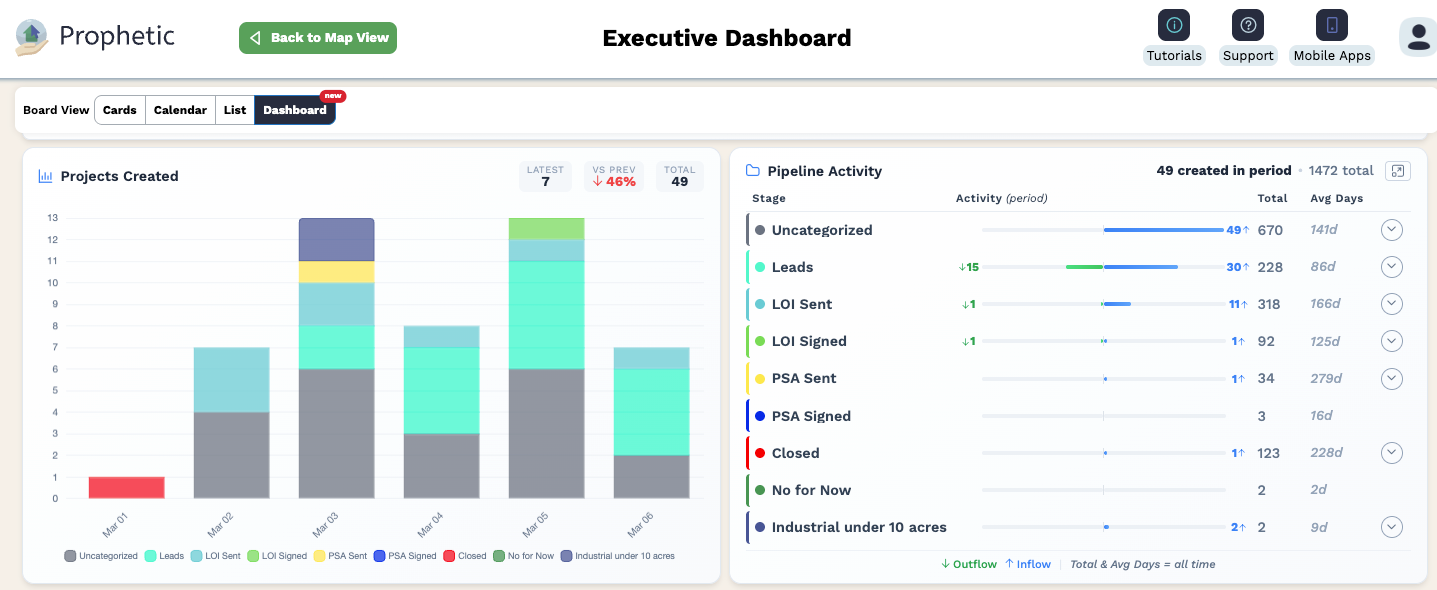
Select one division or all of them. Choose your time period. The dashboard shows you which teams are actively engaged, how projects are moving through each stage of your pipeline, and where deals advanced or stalled in the last seven days. No setup required. No filters to configure. It's there when you open it.
The AI Summary
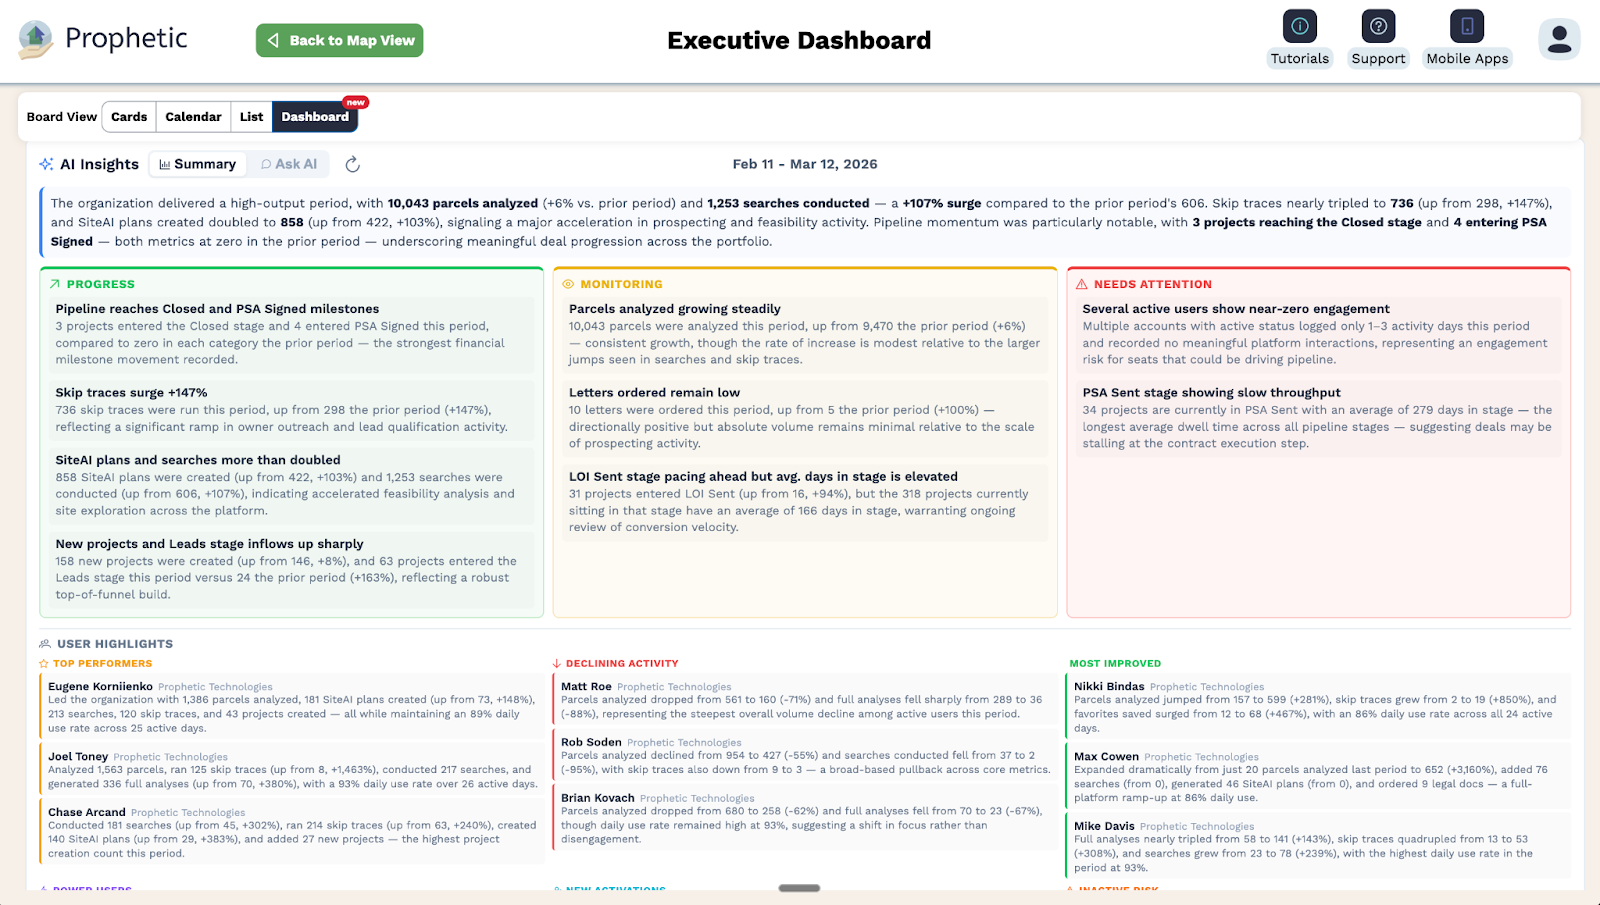
On top of that data sits the AI Summary, a plain-language analysis of team activity generated automatically across any time period you select. It surfaces top performers, flags users at risk of going inactive, and identifies engagement trends across your entire organization. You can also prompt it directly. Ask which division had the most pipeline movement last month. Ask why a metric looks the way it does. Ask for a breakdown by region. The answer is there immediately, without requiring a query or an export.
The Hierarchy Enterprise Teams Actually Need
The Executive Dashboard is role-aware by design. Division directors see their division's activity. VPs and regional presidents see their full scope. Corporate-level accounts see everything. A national builder operating across 30 or more divisions has users rolling up to divisions, divisions to regions, and regions to corporate. The dashboard reflects that structure exactly.
And it does not touch how individual teams work. Division-level acquisition professionals continue using Prophetic exactly as they do today. The Executive Dashboard is an additional view, a corporate lens on top of existing activity, not a change to the workflows already running.
What You Can See That You Couldn't Before
When the data is actually flowing, enterprise land acquisition leadership looks different. You can see which divisions are engaged and which are going quiet before it becomes a problem. You can run your weekly land acquisition meeting off real pipeline stage movement instead of self-reported updates. You can identify inactive users inside an active division before it shows up at renewal. And when the conversation about expanding to additional divisions comes up, you can answer the ROI question on the spot. The engagement data is already there.
Prophetic's enterprise customers across active divisions are logging in and taking meaningful action at a daily use rate that consistently exceeds 95%. The Executive Dashboard puts that number in front of the people who need to act on it.
Built for the Scale You're Already Operating At
The data powering the Executive Dashboard is not new. Every search run, every project stage change, every parcel analyzed and landowner contacted has been captured inside Prophetic from day one. The Executive Dashboard surfaces that data in a structured, role-aware format with AI on top, so the picture your teams have been building every day is finally available to the leaders directing where they go next.
The Executive Dashboard is available now for enterprise accounts with multi-division structures. No configuration required.
Ready to see it in action? Talk to our team.

